


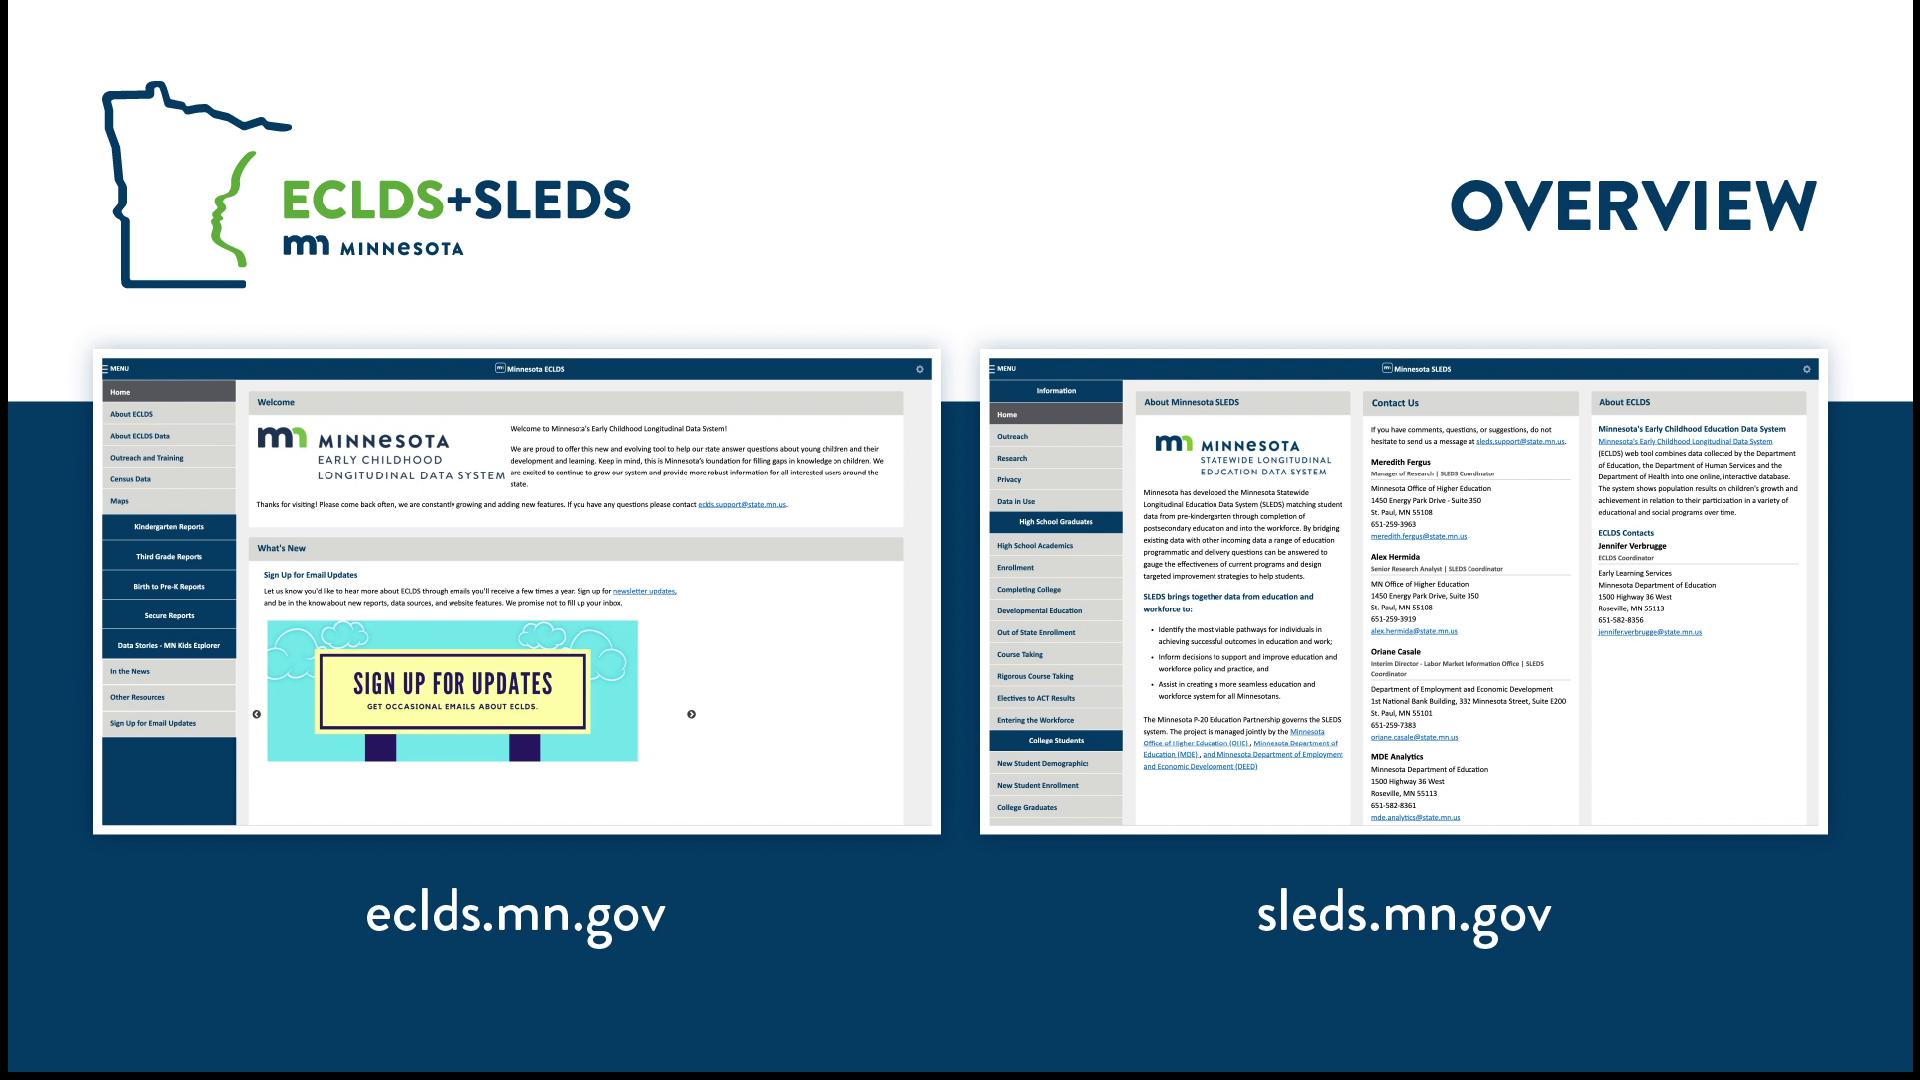
Minnesota has developed the Minnesota Statewide Longitudinal Education Data System (SLEDS) matching student data from pre-kindergarten through completion of postsecondary education and into the workforce. By bridging existing data with other incoming data a range of education programmatic and delivery questions can be answered to gauge the effectiveness of current programs and design targeted improvement strategies to help students.
SLEDS brings together data from education and workforce to:
- Identify the most viable pathways for individuals in achieving successful outcomes in education and work;
- Inform decisions to support and improve education and workforce policy and practice, and
- Assist in creating a more seamless education and workforce system for all Minnesotans.
The Minnesota P-20 Education Partnership governs the SLEDS system. The project is managed jointly by the Minnesota Office of Higher Education (OHE) (opens new window) , Minnesota Department of Education (MDE) (opens new window) , and Minnesota Department of Employment and Economic Development (DEED) (opens new window)
We recommend Chrome on Android
For the best experience, we recommend that you install Google Chrome for Android (opens new window) .
You're using the default browser (often called "Browser" or "Internet"), which has been discontinued and replaced with Chrome. Chrome is the new default because it's faster and more stable, has fewer bugs, and is free and always up to date.
Install Chrome Now (opens new window)We recommend a more up-to-date browser
Right now, you're using Internet Explorer 9, which lacks some of the features that make using SLEDS a great experience. For best results, we recommend that you update to version 11 or newer (opens new window) , or use Mozilla Firefox (opens new window) or Google Chrome (opens new window) instead.
Install Chrome (opens new window) Install Firefox (opens new window) Update Internet Explorer (opens new window)Contact Us
If you have comments, questions, or suggestions, do not hesitate to send us a message at sleds.support@state.mn.us.
Nora Morris
SLEDS Director
Minnesota Office of Higher Education
1450 Energy Park Drive - Suite 350
St. Paul, MN 55108
651-259-3983
nora.morris@state.mn.us
Oriane Casale
Interim Director - Labor Market Information Office | SLEDS
Coordinator
Department of Employment and Economic Development
1st National Bank Building, 332 Minnesota Street, Suite E200
St. Paul, MN 55101
651-259-7383
oriane.casale@state.mn.us
Joe Curiel
SLEDS Coordinator
Minnesota Department of Education
400 NE Stinson Blvd.
Minneapolis, MN 55413
651-582-8631
joseph.curiel@state.mn.us
Steve Rogness
Research Analyst | SLEDS Coordinator
Minnesota Office of Higher Education
1450 Energy Park Drive, Suite 350
St. Paul, MN 55108
651-259-3917
steve.rogness@state.mn.us
About ECLDS
Minnesota's Early Childhood Education Data System
Minnesota's Early Childhood Longitudinal Data System (ECLDS) web tool combines data collected by the Department of Education, the Department of Human Services and the Department of Health into one online, interactive database. The system shows population results on children's growth and achievement in relation to their participation in a variety of educational and social programs over time.
ECLDS Contacts
Jennifer Verbrugge
ECLDS Lead
Early Learning Services
Minnesota Department of Children, Youth, and Families
Minnesota Department of Children, Youth, and Families
444 Lafayette Road N
Saint Paul, MN 55155
651-539-7720
jennifer.verbrugge@state.mn.us
John Burczek Dreier
ECLDS Research Scientist
Early Learning Services
Minnesota Department of Children, Youth, and Families
Minnesota Department of Children, Youth, and Families
444 Lafayette Road N
Saint Paul, MN 55155
651-539-7722
News
SLEDS Proposal Granted $4M to Expand Data-Based Analysis on Students' Progression from High School to Postsecondary and Workforce
- October 2, 2023In Case You Missed it: Summer Data Recap
- September 25, 2023SLEDS Data Partnership Granted Access to AISP Community
- May 25, 2023Data Insights on the Road
- May 25, 2023Suggested Reading and Data Exploration
- May 25, 2023SLDS Spotlight: Supporting Data Use Through an Online Learning Hub
- March 30, 2023Check Out the New Data Upload on Selected Reports
- January 19, 2023Watch the Latest SLEDS Presentation at the NCES STATS-DC Conference
- December 6, 2022An Overview of ECLDS and SLEDS Achievements with SLDS Grant Funding
Explore SLEDS New Report on College Transfers
- December 6, 2022A New Hub for Expanding Your Data Skills
- September 26, 2022An Overview of ECLDS and SLEDS Achievements with SLDS Grant Funding
Meet Our New SLEDS Team Members
- September 26, 2022SLDS Grant Funding Achievements and Other Highlights
- April 8, 2022An Overview of ECLDS and SLEDS Achievements with SLDS Grant Funding
New data for SLEDS is now available
- December 15, 2021Take a closer look at what data tells you about Minnesota high school graduates and how they compare to students in your district, county or region.
SLEDS Represents Nationally
- April 5, 2021Minnesota Participates in National "SLDS and COVID-19" Workshop
Annual Report and New MCIS Secure Report
- April 5, 2021Beyond describing the scope and purpose of both data systems, the 2020 Annual Report recalls the achievements seen in the last two years and lays out the strategies our leadership will focus on in the near future.
Winter Data Upload Completed
- December 14, 2020This week we finalized the data upload to SLEDS and ECLDS.
ECLDS' Comprehensive Services Map Finds New Users During Pandemic
- December 14, 2020Ever since the coronavirus pandemic took hold in Minnesota, priorities have shifted to respond appropriately to this public health emergency. Such was the case of the Early Childhood Longitudinal Data System (ECLDS)'s comprehensive services map, which re-imagined its potential use and application towards finding essential services at a local level in Minnesota.
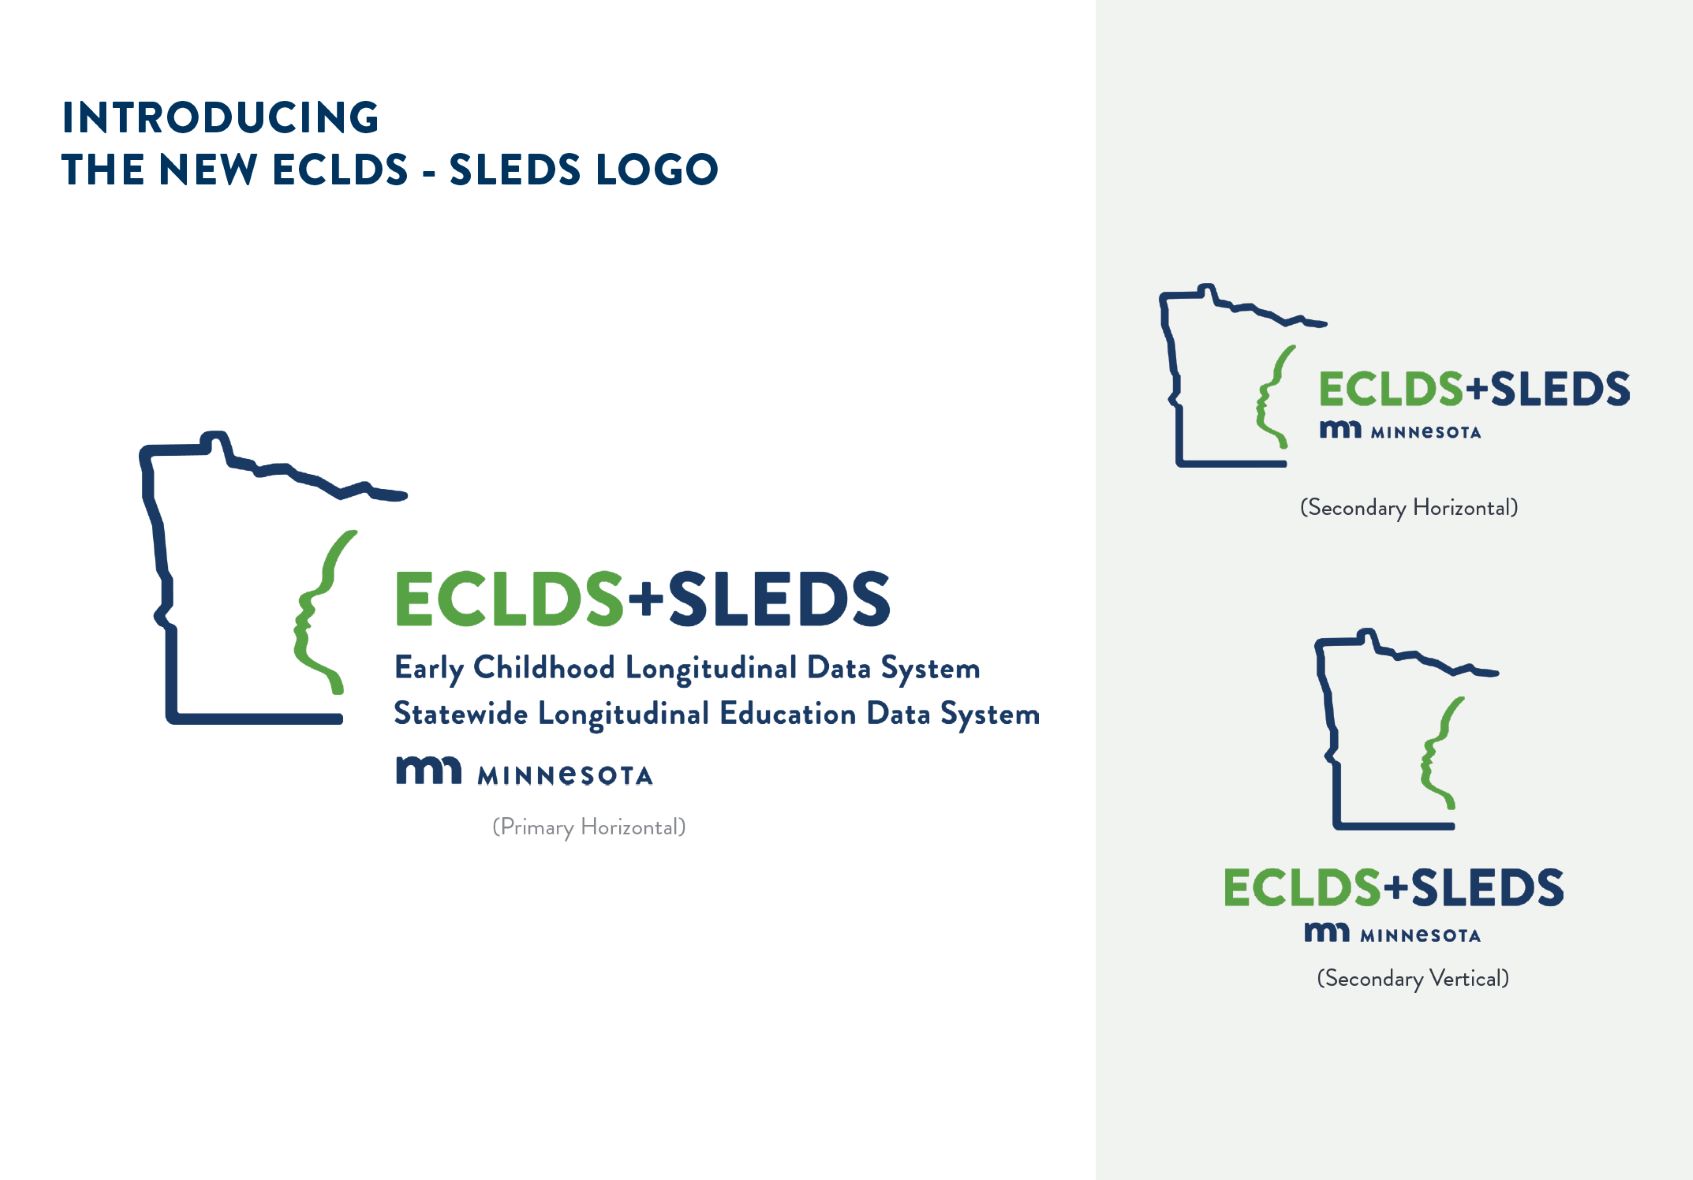
Introducing the ECLDS + SLEDS Logo
- December 11, 2020We are thrilled to roll out the new combined logo for Minnesota's Early Childhood Longitudinal Data System and the Statewide Longitudinal Education Data System.
Latest Resources and Publications
- September 18, 2020We Have Expanded Our Regional Coaching Network!
A New Year of Data Available on Public and Secure Reports
- September 1, 2020In August, we finalized the data upload on SLEDS for both the public site and secure reports.
New Enrollment Report Reveals Which Minnesota High School Graduates Attend College Outside the State
- January 23, 2020According to SLEDS Enrollment Report, approximately 20% of Minnesota high school graduates (11,550) enroll annually in college outside Minnesota.
Minnesota college graduates show positive outcomes a few years into the workforce
- January 23, 2020We start 2020 taking a deep look into the employment outcomes of Minnesota college graduates a few years after graduation.
News

Minnesota college graduates show positive outcomes a few years into the workforce
- January 23, 2020We start 2020 taking a deep look into the employment outcomes of Minnesota college graduates a few years after graduation to answer the following questions:
- How many graduates are found employed two years after graduation?
- What are their median wages for part-time and full-time employment?
- Which type of credentials offer graduates higher wages and higher rates of full-time employment?
- Are racial disparities in income and full-time employment persisting with higher degrees?
- What are the prospects for growth in income for each type of degree earned?
SLEDS' latest infographic, titled Jobs and Wages After College, depicts a positive outlook for Minnesota college graduates, both related to employment and wages, showing that earning a higher degree does pay off in time (see "Graduates with higher degrees earn more and have higher rates of full-time employment").
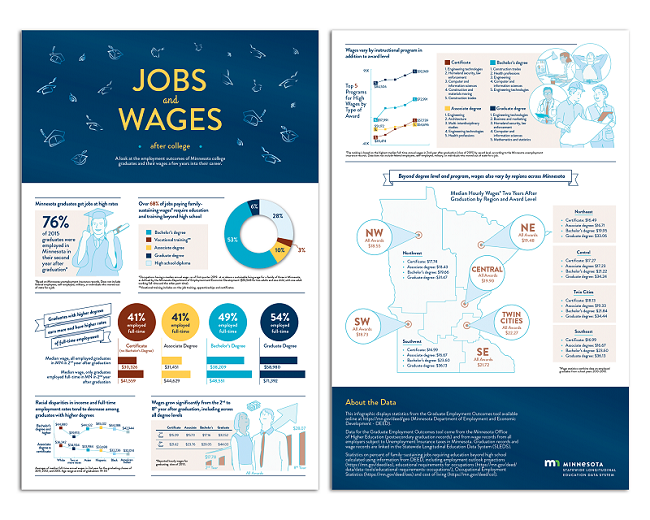
In addition, the infographic highlights statistics on wages to provide a ranking of instructional programs for high wages by type of award (certificate, associate degree, bachelor's degree, and graduate degree) that is based on the highest median full-time annual wages in the second year after graduation (class 2015). Finally, regional data on median hourly wages of graduates in the second year after graduation is displayed to compare how outcomes vary across Minnesota.
Jobs and Wages After College was designed to best display information that may escape the average user of a data tool, from presenting stats that sustain the proposition in favor of pursuing a postsecondary degree to the growth in wages seen at all degree levels. Statistical data used to create the infographic was sourced from the Graduate Employment Outcomes tool available online at https://mn.gov/deed/geo (Minnesota Department of Employment and Economic Development - DEED), which bridges data from the Minnesota Office of Higher Education (postsecondary graduation records) and wage records from all employers subject to unemployment insurance taxes in Minnesota. Graduation and wage records are linked in the Statewide Longitudinal Education Data System (SLEDS).
Other data sources include employment outlook projections, educational requirements for occupations, occupational employment and wages and cost of living.
We hope the Jobs and Wages After College infographic serves you to spark conversations among your peers around Minnesota college graduate outcomes. If you have any questions about the information and data shared in this infographic, please send an email to sleds.support@state.mn.us. We appreciate your feedback and look forward to learning about your experience with SLEDS.
 Previous
News

New Enrollment Report Reveals Which Minnesota High School Graduates Attend College Outside the State
- January 23, 2020According to SLEDS Enrollment Report, approximately 20% of Minnesota high school graduates (11,550) enroll annually in college outside Minnesota. With the newly released Out-of-State Enrollment report, SLEDS users can learn more about the population of high school graduates who decided to pursue their postsecondary education out of the State and how successful they were. Using data from the National Student Clearinghouse, the report shows eight years of student data from the time of high school graduation for classes 2010 - 2018 to inform users about the educational outcomes of Minnesota graduates at out-of-state institutions.
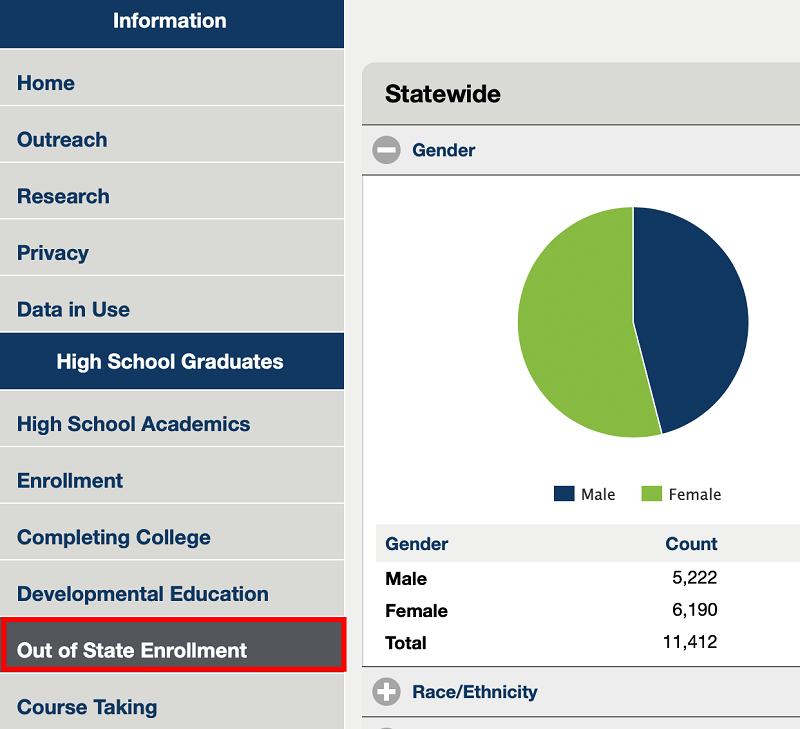
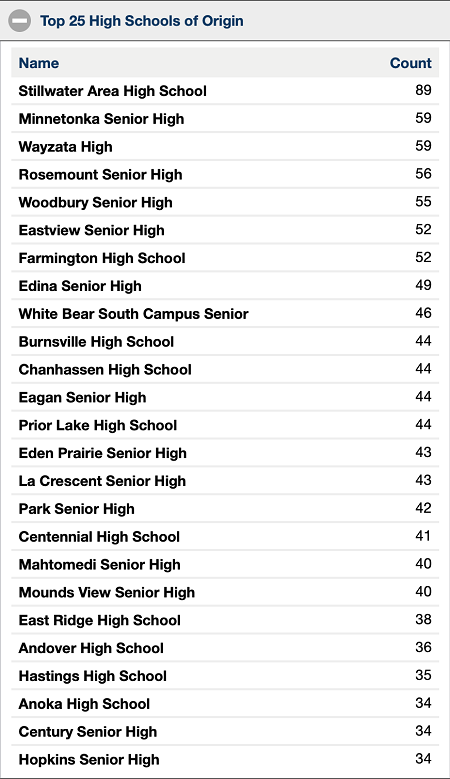
The Out-of-State Enrollment report offers users the ability to review demographic information of Minnesota high school graduates studying outside Minnesota, such as gender, race/ethnicity, special characteristics (free/reduced priced meals, special education, English learner), ACT scores, and the 25 top high schools of origin. In addition, outcomes reported include persistence rates during the first and second years and completion rates at the institution of choice.
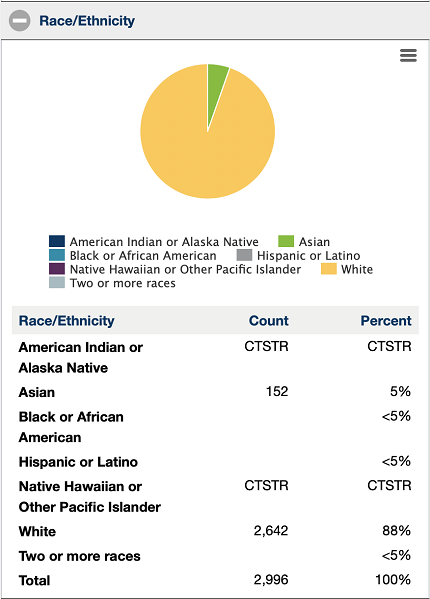
To look up a specific high school, users should access the filtering options and type in the name of the high school or school district. It is also possible to filter a search by the state in which the college of enrollment is located. For example, if we look up how many Minnesota high school graduates from class of 2018 went to college in Wisconsin (access the filtering options and use the College State filter), the report will show that 2,996 graduates enrolled in postsecondary institutions in that state (59% female; 41% male). We will also learn that a large majority (88%) were White, 5% were Asian, and the remaining 7% were Black or African American and Hispanic or Latino.
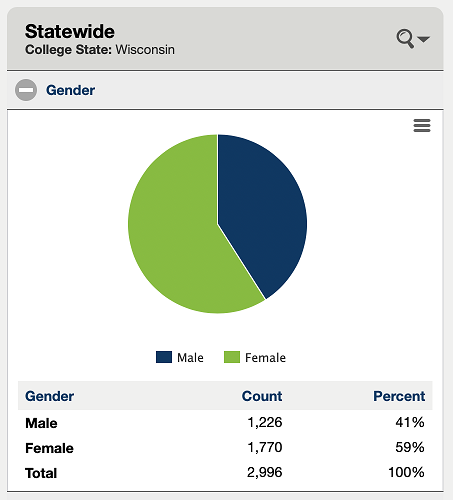
More interestingly, we can learn from the report that the largest number of 2018 graduates enrolled in college in Wisconsin graduated from Stillwater Area High School (89 graduates).
Users may also filter results by type of postsecondary institution and/or college. Definitions are provided by selecting the Filter Definitions link at the bottom of the pane.
If you are new to SLEDS, or would like assistance with navigating this new report, we encourage you to contact a regional data coach (RDC) for an in-person demonstration of the Out-of-State Enrollment report or any other report on SLEDS. Go to the Network pane on the Outreach page to find out your assigned RDC.
We care about your experience with SLEDS. Please, share with us your feedback, comments, or questions by sending an email to sleds.support@state.mn.us.
News
A New Year of Data Available on Public and Secure Reports
Release date: September 1, 2020In August, we finalized the data upload on SLEDS for both the public site and secure reports. If you are currently exploring our reports on the public site, you will access and view data for 2019 high school graduates, fall 2019 enrolled college students, and 2018 college graduates. Take a closer look at what data tells you about Minnesota high school graduates and how they compare to students in your district, county or region. Our reports can help you learn about your students, assess educational shortcomings, and inform possible strategies to support positive outcomes in all students.
- How many 2019 high school graduates in your school district moved onto college?
- Which colleges are they enrolling to?
- What happened to those graduates who did not enroll in college?
- How does your graduate class of 2019 compare to prior years? How does it compare to similar school districts, and statewide data?
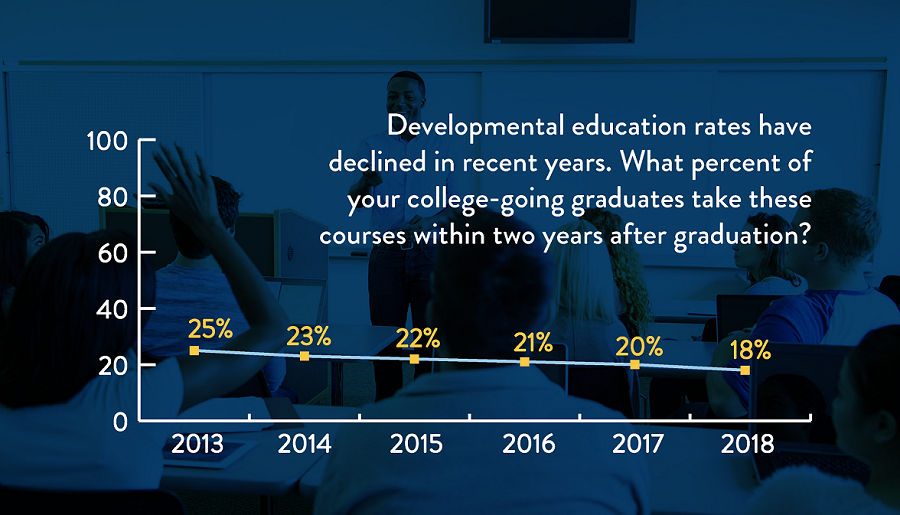
- How many 2019 high school graduates who enrolled in college took developmental education courses?
If you have access to SLEDS Secure Reports, make sure to check the newly released data on K-12 Research Data Mart and Postsecondary Research Data Mart.
Additionally, expand your understanding of the educational outcomes of Minnesota students by exploring the latest cohort available on the Graduate Employment Outcomes tool (GEO). This tool shows how many recent Minnesota college graduates found Minnesota jobs one and two years after graduation, with median earned wages and top industries of employment.
If you would like assistance with navigating our reports, don't hesitate to contact a regional data coach (RDC) for an online demonstration. We recently expanded our Regional Coaching Network. Please, visit the Outreach page to find out your assigned RDC or check out the list of counties served by each member.
.News

Latest Resources and Publications
Release date: September 18, 2020We Have Expanded Our Regional Coaching Network!
Navigating data on ECLDS and SLEDS is a learning experience for most users. Some of them may need a guided introduction to data analysis for their decision-making. For this reason, the Minnesota P-20W has extended the regional coaching network to better serve ECLDS and SLEDS users. The network works closely with data users to address the technical issues that may arise when accessing, using, and applying data shown on both systems.
Regional Coaching Network members perform the following activities:
- Training state, local, and partnering agency staff
- Coordinating data analysis activities in partnership with the state, school districts, and communities
- Assisting with databased planning and program evaluation
- Developing products and services to improve user experience, as guided by SLEDS coordinators
- Facilitating projects with external partners
- Incorporating feedback to improve products and services
- Overseeing special regional studies about education, college, and career planning
- Coordinating and conducting original education data analysis
- Serving as an expert resource to education stakeholders and partner agencies
- Assessing education research and information resource needs
- Responding to requests for information and analysis
- Representing ECLDS and SLEDS at regional meetings
Our regional data coaches work proactively with local schools, districts, colleges, and workforce agency staff, as they assess their local needs and encourage the use of ECLDS and SLEDS data to inform policymaking and program decisions.
If you are new to SLEDS or would like assistance with data analytics, contact a regional data coach close to you.
Resources to Improve Your Data Navigation
We recently published new resources for beginner SLEDS users to help them explore our data reports and identify what type of data is available to them. Both the High School Graduates Report Cheat Sheet and the College Students Report Cheat Sheet can help users better understand the research questions behind each report, data indicators, and filters available.
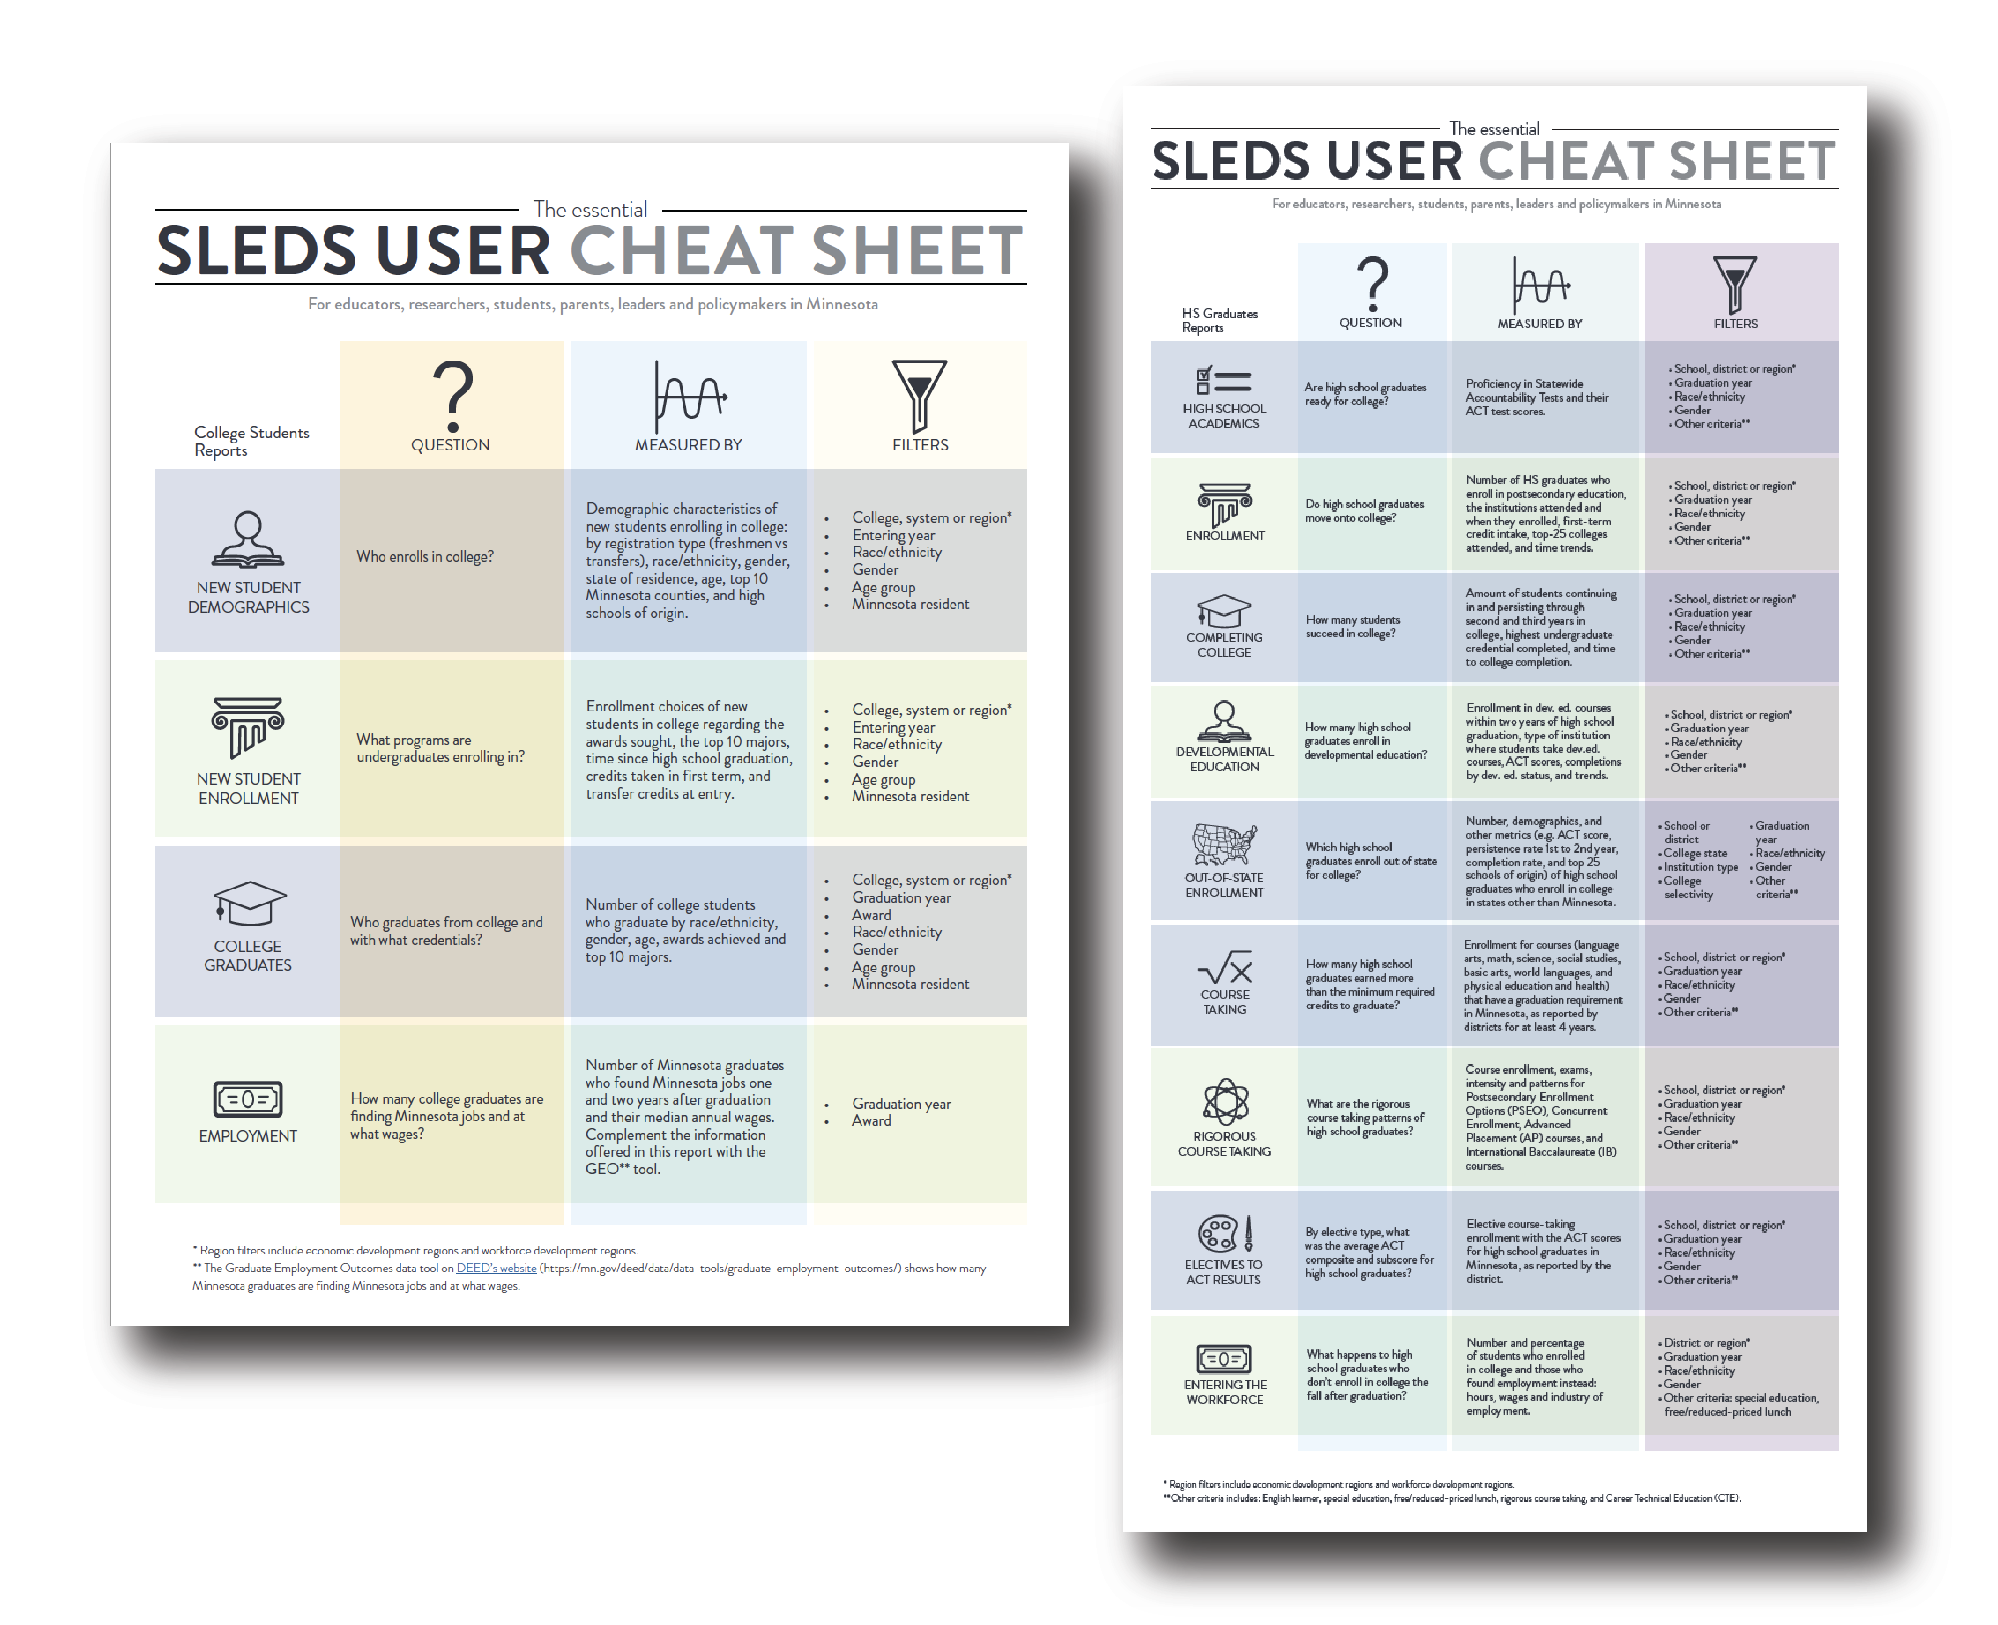
Each report is designed to help identify the benchmarks and transition milestones students meet toward high school graduation and into college, and as college students into the workforce, with the goal of providing an understanding of the current pathways that lead students to successful outcomes in higher education and work.
We hope you find these materials useful to your data exploration experience. You may find more resources on the Outreach page.
New Publication: "Trends, Transitions, and Subgroup Differences on the Pathway to a Family-Sustaining Hourly Wage for Minnesota Students"
The University of Minnesota's Center for Applied Research and Educational Improvement (CAREI) recently published a new report on the education pathways Minnesotans take, exploring whether or not these pathways led them to earn a family-sustaining hourly wage as an adult.
Researchers used SLEDS data to examine the educational pathways and economic outcomes of individuals who entered high school (Grade 9) in the 2004-05 school year. The study followed their pathways through 2017 and incorporated data from four additional cohorts who entered high school in 2005-2008, plus wage data through June 2018, in order to answer questions about trends, transitions, and subgroup differences.
News

Introducing the ECLDS + SLEDS Logo
Release date: December 11, 2020We are thrilled to roll out the new combined logo for Minnesota's Early Childhood Longitudinal Data System and the Statewide Longitudinal Education Data System. You may find the new logo on some of our outreach materials when both data systems are promoted. The logo embraces the complementing role both data systems play in understanding the long-term outcomes related to public investments in human development and education, from early childhood to postsecondary.
We hope you like it.
News
ECLDS' Comprehensive Services Map Finds New Users During Pandemic
Release date: December 14, 2020Ever since the coronavirus pandemic took hold in Minnesota, priorities have shifted to respond appropriately to this public health emergency. Such was the case of the Early Childhood Longitudinal Data System (ECLDS)'s comprehensive services map, which re-imagined its potential use and application towards finding essential services at a local level in Minnesota.
The ECLDS comprehensive services map launched in June 2019 as a geolocation service to help individuals and families visually locate nearby support programs and resources. With the advent of the coronavirus, essential workers were in desperate need to locate and access child care services to be able to go to work daily. More than 4,000 family and center-based child care providers have informed Minnesota Management and Budget that they are currently able to provide care for children of essential workers during the COVID-19 pandemic. Using the ECLDS' comprehensive services map, essential workers can find available care providers closest to them on in relation to their home, work, or other address. For the official MMB map of locations, visit the MMB COVID-19 child care page.
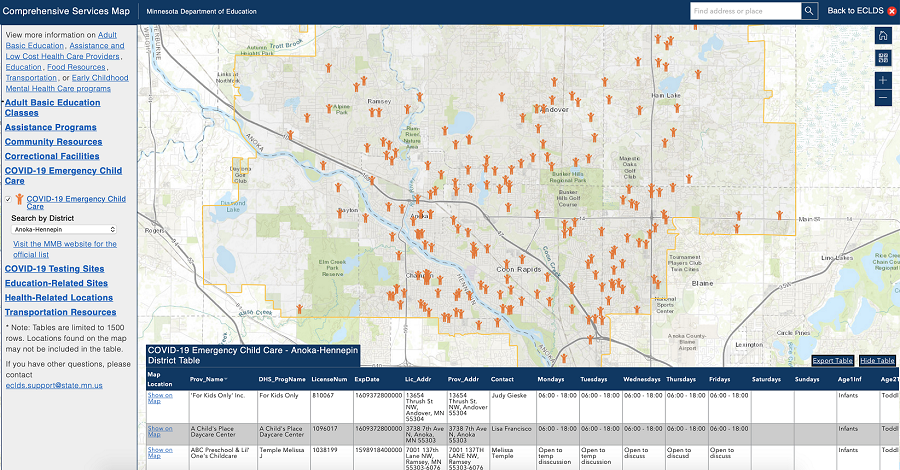
Moreover, the map has made possible for school districts to locate emergency child care sites within district boundaries through a simple search on the map. They have put together a flyer with step-by-step instructions for gathering this information. Additionally, COVID-19 testing sites have also been added to the map for quick location in your community.
Finally, by adding layers for essential sites including nursing homes, hospitals, and correctional facilities to the comprehensive services map, ECLDS was able to help Child Care Aware of MN include proximity scoring in its evaluation rubric of thousands of Peacetime Emergency Child Care Grant applications.
We highlight ECLDS' work for repurposing their data tool as a resource in the fight against COVID-19. We invite you to explore it yourself and share with your network.
Please, let them know about your experience by submitting your feedback, comments, or questions via email to eclds.support@state.mn.us.
News

Winter Data Upload Completed
Release date: December 14, 2020This week we finalized the data upload to SLEDS and ECLDS. Take a few minutes to check for yourself the data updates on the following High School Graduates and College Students reports:
HS Graduates:
- Enrollment
- Completing College
- Developmental Education
- Out of State Enrollment
- Course Taking
- Entering the Workforce
College Students:
- New Student Demographics
- New Student Enrollment
- College Graduates
On the SLEDS website, you can access and view college enrollment data for 2019 high school graduates in Minnesota and analyze how they compare to students in your district, county, or region. Our reports can help you learn about students, assess educational shortcomings, and inform possible strategies to support positive outcomes in all students. The following are a sample of questions you may want to ask:
- How many 2019 high school graduates in your school district enrolled in college the fall after graduation and where did they enroll?
- What percent of 2019 high school graduates were required to take developmental courses upon entering college and at which type of institution?
- Which out-of-state postsecondary institutions 2019 Minnesota high school graduates enrolled in the fall after graduation?
- What percentage of 2019 Minnesota high school graduates entered the workforce the fall after graduation and in which industries were they working?
- How does your graduate class of 2019 compare to prior years? How does it compare to similar school districts, and statewide data?
Finally, jump onto the College Students reports to look at the updated new college students demographic and enrollment data, and college graduates report (awards by race/ethnicity, gender, and age, and top ten majors).
If you have access to SLEDS Secure Reports, make sure to check the newly released data on K-12 Research Data Mart and Postsecondary Research Data Mart.
Additionally, take an exploratory data journey to the Early Childhood Longitudinal Data System (ECLDS) to check out the latest data available for the Scholarships and Parent Aware reports, under Birth to Pre-K Report. If you are interested in finding out more about your community's children, make sure to try out the Census Tool which provides detailed American Community Survey (ACS) tables for a variety of topics about kids (ages 5 and under) for all states, Washington D.C., and Puerto Rico. The ECLDS Census Tool now includes ACS estimates from 2006-10 and 2011-15 for a more longitudinal look at your state or county's youngest kids and their families.
If you would like assistance with navigating any of the SLEDS or ECLDS reports, don't hesitate to contact our Regional Coaching Network for an online demonstration. You can find the assigned regional data coach to your county by visiting our Outreach page.
News
The ECLDS+SLEDS 2020 Annual Report
Release date: April 5, 2021Beyond describing the scope and purpose of both data systems, the 2020 Annual Report recalls the achievements seen in the last two years and lays out the strategies our leadership will focus on in the near future. The Annual Report offers an opportunity for reflection on the efforts that brought ECLDS and SLEDS to their current status, and provides direction for the work in the years to come that will build a sustainable data system. Read the latest report.
As Minnesota faces new and unknown challenges in education and the workforce, we recognize the importance of strengthening our relationship with diverse stakeholder groups and helping them expand their use of data for identifying opportunities for improvement. We are determined to position data use as a valuable asset to their strategic public investments.
Explore the New MCIS Secure Report
With the conclusion of the pilot year of the data-linking project between the Statewide Longitudinal Education Data System (SLEDS) and the Minnesota Career Information System (MCIS), a new secure report has been released that provides insight on the value of planning for career and college outcomes. The MCIS secure report provides rich data from students' portfolios, including their Personal Learning Plan (PLP). The MCIS is a web-based career planning tool for high-school students designed to help them identify viable paths to successful postsecondary education and careers.
Minnesota requires that all high school students develop a PLP to help them set goals, reflect on self-knowledge and career aspirations, identify career pathways, and create reasoned plans for their future. The career development process allows students to save their discoveries and organized them in an embedded portfolio that includes the PLP. Additionally, students' portfolios store search and assessment results and reflections, resulting in dynamic PLPs that can provide information about trends in career aspirations, gaps in student understanding of available options, and other key areas.
The new MCIS secure report is an exciting source of rich information because of the data sources it is built on. The report offers stakeholders the opportunity to better understand, research, and predict early planning actions for the purpose of increasing the likelihood of career and college outcomes.
News

Minnesota Participates in National "SLDS and COVID-19" Workshop
Release date: April 5, 2021The workshop focused on how COVID-19 has presented unprecedented challenges for data collection while simultaneously offering opportunities to demonstrate the critical value of SLDSs. This virtual workshop provided a venue for SLDS teams to learn from one another about how they are responding to COVID-19 data collection, quality, reporting, and analyses challenges.
Karen Millete and Gayra Ostgaard represented Minnesota — presenting about Digital Equity, Safe School data, and P-EBT (distribution of food funds during pandemic).
U.S. Department of Education Highlights Minnesota in Several Recent Publications
The Evolution of P20W Data Linking, MN.IT, OHE, and MDE: This white paper describes the chronological evolution of Minnesota's person-linking engine. The state has moved from linking personal records only in its Statewide Longitudinal Education Data System (SLEDS) to linking personal records across SLEDS and the Early Childhood Longitudinal Data System and, finally, to linking persons and families.
SLDS Issue Brief: Interagency Data Linking and Common Identifiers: This brief offers best practices and strategies from several states related to setting goals for cross-agency data sharing, identifying requirements from data sharing partners, establishing technical solutions and processes to link data in a P-20W+ SLDS, and collaboratively governing interagency data collections. Featured states: Kentucky, Minnesota, Washington
State Spotlight: Minnesota's Early Childhood Longitudinal Data System: This spotlight provides an overview of the Minnesota Early Childhood Longitudinal Data System (ECLDS). It is part of a series of spotlights intended to show how some states have used ECIDS data to create data tools, reports, and other resources to answer specific questions.
News
New data for SLEDS is now available
Release date: December 15, 2021New data for SLEDS for both the public site and secure reports is available. Take a closer look at what data tells you about Minnesota high school graduates and how they compare to students in your district, county or region. Our reports can help you learn about your students, assess educational shortcomings, and inform possible strategies to support positive outcomes in all students.
- How many 2020 high school graduates in your school district moved onto college? Which colleges are they enrolling to?
- How many 2020 high school graduates found work instead of enrolling in college?
- How does your graduating class of 2020 compare to prior years? How does it compare to similar school districts, and statewide data?
- How many 2020 high school graduates in college enrolled in developmental education courses?
If you have access to SLEDS Secure Reports, make sure to check out the newly released data on K-12 Research Data Mart and Postsecondary Research Data Mart.
Additionally, expand your understanding of the employment outcomes of Minnesota students by exploring the Graduate Employment Outcomes tool (GEO). This tool shows how many recent Minnesota college graduates found Minnesota jobs one and two years after graduation, with median earned wages and top industries of employment.
If you would like assistance with navigating our reports, don't hesitate to contact a regional data coach (RDC) for an online demonstration. We recently expanded our Regional Coaching Network. Please, visit the Outreach page to find out your local RDC or check out the list of counties served by each member.
News
SLDS Grant Funding Achievements and Other Highlights
Release date: April 8, 2022
An Overview of ECLDS and SLEDS Achievements with SLDS Grant Funding
For the last seven years, the Minnesota Statewide Longitudinal Education Data System (SLEDS) and the Early Childhood Longitudinal Data System (ECLDS) have grown with federal funds awarded by the Statewide Longitudinal Data System (SLDS) Grant Program. With the culmination of the last awarding period on March 31, 2022, we would like to highlight the accomplishments made possible by this program.
With SLDS-15 grant funding, Minnesota has:
- Expanded data partnerships and linkages
- Increased data literacy
- Enabled new data linking processes
- Improved data collection
- Increased engagement among stakeholders
- Increased information available to educators, policymakers, and other leaders at the local, regional, state, and national level
ECLDS Achievements
The SLDS grant funding made possible for ECLDS to develop and complete the following projects:
- GrEaT - Growing Evaluability Together: This project facilitated local use of ECLDS and built evaluation capacity. Over three years, staff from the Minnesota Department of Education (MDE) worked closely with a dozen district-based early childhood programs struggling with problems related to data use, information gathering, measurement, and/or efficiency. This work culminated with a toolkit that has served communities around the state and nation.
- Video tutorials: We produced a suite of six videos that both explained how to use the ECLDS and how early childhood services work. Recently, we expanded the collection of video tutorials with the help of our Regional Coaching Network.
- Survey on ECLDS website: This project developed a brief, yet informative, user survey so we better understand how ECLDS is being used. The survey is optional, and only pops up when a user clicks the Export to PDF button in a report.
- Expanded data: We incorporated more birth record data into our reports through added filter buttons and built new reports using MDE's early childhood screening data. We also built secure reports for our Head Start agency partners.
- Census Data Tool: This project delivered a data tool that includes American Community Survey data in smaller age bands to help early childhood program administrators in their planning and evaluation.
- Family ecology pilot: We linked SLEDS OHE Postsecondary Completer data to ECLDS data in order to explore mom's educational changes after giving birth.
- Economic analysis study: We produced a 20-page analysis that demonstrates the return on investment and economic value of the continued existence of ECLDS.
SLEDS Achievements
The SLDS grant funding made possible for SLEDS to develop and complete the following College and Career Readiness projects:
- Regional Coaching Network: Established as a pilot under the SLDS 2015 Grant and expanded in 2019 with state funding, the Network has increased our capacity to engage with local leaders. It currently has 23 individual staff working part-time and integrating ECLDS and SLEDS data into regional/local education, workforce, and community development planning.
- Testing 1-2-3: This website provides teachers and educators with reliable data use it to eliminate learning barriers and evaluate classroom instruction.
- Dual Credit Reporting: The project collected and integrated dual credit data into SLEDS reports.
- Reporting on At-Risk Student Transitions: The project focuses on pathways and outcomes for non-high school graduates, providing data to local Adult Basic Education programs for evaluation, grants, and reporting.
- MCIS Data Linking and Reporting: The Minnesota Career Information System (MCIS) Data Mart files provide graduate outcome data for schools in the SLEDS-MCIS project. These de-identified data are pulled from saved information in a user's MCIS portfolio and from relevant data available in SLEDS to allow schools to measure the impact of planning on career and college outcomes. Schools can use the data to better understand, research, and plan for the increased likelihood of career and college outcomes.
- Health Care Licensure Data Integration: Collected from a multitude of licensing boards, the project allows us to measure employment in areas that are not included in unemployment insurance wage detail records. The project provides a means for evaluation of state programs and policies implemented to increase health care employment for specific occupations and locations.
- Workforce Alignment Tool: The project developed a data tool that matches education programs to occupations to help users identify insights (and data) regarding occupational pathways as they related to fields of study for bachelor's degree completers. The tool provides proof of the value of integrating occupation data into unemployment insurance wage detail records.
We are proud of these accomplishments and grateful to our partners who contributed to and supported the work.
Updated Resources for Your Data Exploration: Video Tutorials
For the past months, we have been updating some of the video tutorials on the website. SLEDS video tutorials can teach you how navigate the website and the online reports by offering step-by-step guidance through specific sections and reports, at your own pace, to build your data skills and proficiency. We recently updated the tutorial titled Completing College. This tutorial explains how to interpret the data shown about students continuing in and persisting through college. Viewers can learn the steps to filter data for a customized view for selected reports, such as Highest Undergraduate Credential Completed, and how to compare schools over time and to each other.
Additionally, we posted the updated tutorial for navigating the SLEDS report Entering the Workforce. By watching this tutorial, beginner SLEDS users can learn the steps to filter data for a customized view of the number of high school graduates -in a school district or region- who are working, their hours and wages, and industry of employment.
If you want to check out other video tutorials available to users, visit the Outreach page, and scroll down to the pane titled Video Tutorials. If you find these videos helpful, please consider sharing them with your colleagues to spark conversation about data exploration, expand their knowledge of SLEDS reports, and apply the latest data available in their reporting.
SLDS Spotlight: State Approaches to Engaging and Sustaining Postsecondary and Workforce Partners
The Institute of Education Sciences (IES) recently released their latest case study "State Approaches to Engaging and Sustaining Postsecondary and Workforce Partners". The document highlights the different approaches for sharing postsecondary and workforce data taken by selected SLDS programs, including Minnesota's. Discussion centers in the work done by state agencies in regards to data sharing, data integration, and data management in support of education and workforce initiatives at each state.
News

Request for Proposals: Research Services for Credentials of Value Report
Release date: July 18, 2024
The Minnesota Office of Higher Education (OHE) is currently accepting proposals to create a report analyzing job posting data to identify credentials available to Minnesotans that are aligned to occupations that meet demand and wage thresholds, as articulated in the criteria listed in the Minnesota P-20 Education Partnership’s Quality Credentials of Value framework.
The Quality Credentials of Value Framework is a report developed by a workgroup of the MN P-20 Education Partnership and published in May 2023. The P-20 sought to create a state definition of credentials of value, and produce a list of credentials that meet the criteria. Credentials include degree and non-degree credentials, including education credentials and industry-recognized credentials (whether certificates, licenses, registered apprenticeship completion certificates, or other certifications). OHE is taking the lead on this project coming out of the P-20 report.
Minnesota already publishes employment outcomes by academic program for institutions and programs participating in state financial aid. However, data on non-credit, non-degree credentials is more limited. The purpose of a Credentials of Value report is to fill a data gap by examining which credentials available to Minnesotans align to occupations that meet demand and wage thresholds.
The selected contractor will produce an accessible Microsoft Word or PDF report on which credentials (degree, non-degree, and industry-recognized credentials) meet these criteria; a dataset of all credentials analyzed along with their associated occupations with demand and wage indicators; and documented procedures to allow for replicability in the future. Criteria include alignment to occupations that:
- are in-demand either regionally and/or statewide, and
- provide a family-sustaining wage either regionally and/or statewide, opportunity for economic mobility, or meet essential community needs.
The report should address: an overview of the Minnesota credential landscape, methodology for determining the alignment of credentials to occupations that meet demand and wage thresholds, a list of the credentials showing the number of associated occupations, as well as the occupations’ levels of demand and wages, and limitations. Non-credit, non-degree credentials should list their associated level of education. Analysis should draw on job posting data sources such as Lightcast, the National Labor Exchange, JobsEQ, or similar data sources.
If you are interested in learning more about this opportunity, please visit the SWIFT Supplier Portal. Select “Bidding Opportunities” and search by Event ID 2000015961 to review the request for proposals documents.
Instructions for Responders
Follow the steps below to complete your response to this Solicitation:
- Step 1: Read the solicitation documents and ask questions, if any
- Step 2: Write your response
- Step 3: Submit your response
A response must be submitted along with any required additional documents. Incomplete responses that don't subscribe to the required format and content may be rejected.
Do you have any questions?
Don't hesitate to reach out. Please send an email to SLEDS Coordinator and Senior Research Analyst Steve Rogness at Steve.Rogness@state.mn.us.
News

Announcement
SLEDS Proposal Granted $4M to Expand
Data-Based Analysis on Students' Progression from High School to Postsecondary and
Workforce
Release date: October 2, 2023
It is with excitement that we would like to announce that the Minnesota Statewide Longitudinal Education Data System (SLEDS) has been awarded a $4 million grant by the US Department of Education and the Institute of Education Sciences (IES) to implement the proposed project "Expanding Access to Student-Centered Learning to Improve Pathways to Educational and Career Attainment" in the next four years. The decision was made public on September 25, 2023. "This has been very exciting news", said SLEDS Director Nora Morris. "The team worked hard to pull together a strong proposal that will build on the existing system to better answer questions and inform policy for all Minnesotans."
Minnesota is a recognized leader for its role in providing full data integration from early education to workforce. SLEDS reports focus on Minnesotans' experiences transitioning from high school to postsecondary education and into the workforce and are a source of data-based insights for educators, policymakers, and other decision-makers. SLEDS promotes the use of data to identify barriers for educational attainment, including the persistent racial disparities in academic achievement, in order to find responsive solutions that benefit students. The awarded proposal aims to increase understanding of students' progression from high school to postsecondary and workforce participation; by expanding its data reporting capabilities, SLEDS will produce comprehensive information essential to state leaders and program administrators dedicated to enact policies and programs that close persistent outcome gaps.
"Collecting information on student-centered high school initiatives will enable a more systematic and detailed understanding of the pathways which students follow as they move from K-12 education to college and the workforce" —said Project Director and SLEDS Coordinator Maira Rosas-Lee— "We hope this project will impact students and district leaders to raise more awareness of the nontraditional opportunities that lead to positive academic and workforce outcomes. Not all career paths are linear and our education systems should reflect what those pathways are through our data reports."
The project intends to achieve its core objective via the following four related initiatives:
- Expand collection, reporting, and analysis of data on learner-centered education programs and outcomes in K-12 education.
- Enhance overall knowledge of non-traditional education pathways and outcomes through expanded SLEDS public and secure reporting.
- Widen the scope of postsecondary education and employment information available through public reports.
- Explore pathways to graduation, workforce participation, and a family-sustaining wage, with a focus on the Early Care and Education (ECE) workforce.
"Given the impact of early care and education in providing a base for long-term student success, and potentially on students' ability to enter later pathways leading to positive postsecondary and workforce outcomes, understanding the pathways which lead educators to enter (and exit) this field is also of extreme importance, especially in addressing potential teacher shortages within the ECE field", said Ms. Rosas-Lee.
The awarded funds will cover an expansion of the research and data collection team. The project will hire six new staff to help collect new data from schools and districts, postsecondary pathways and outcomes, workforce and employment participation, and integrate them into SLEDS reports.
The success of the now funded proposal relies on Minnesota's P-20W, a fully interoperable, enterprise-level data collection, reporting, and analysis system managed jointly by the Minnesota Office of Higher Education (OHE) and partnering state agencies including the Minnesota Department of Education (MDE), Minnesota Department of Employment and Economic Development (DEED), Minnesota Department of Health (MDH), Minnesota Department of Human Services (DHS), Minnesota Professional Educator Licensing and Standards Board (PELSB), and Minnesota Department of Corrections (DOC).
The SLEDS team is hoping for their partners to be actively engaged and involved in the process of creating the new data reports, especially district leaders and students. "We hope this project will impact students and district leaders to raise more awareness of the nontraditional opportunities that lead to positive academic and workforce outcomes", said Dr. Morris. "Not all career paths are linear and our education systems should reflect what those pathways are through our data reports."
We thank the IES for the award and are grateful for their confidence in SLEDS and our collaborative effort from all our partners.
News

In Case You Missed it: Summer Data Recap
Release date: September 25, 2023
A New School Year, A New Year of Data for Your Exploration
During the summer, a data upload was completed to SLEDS and ECLDS. Take a few minutes to check your favorite public reports and customize your reporting to include comparisons between graduation years, school districts, regions, and specific demographics.
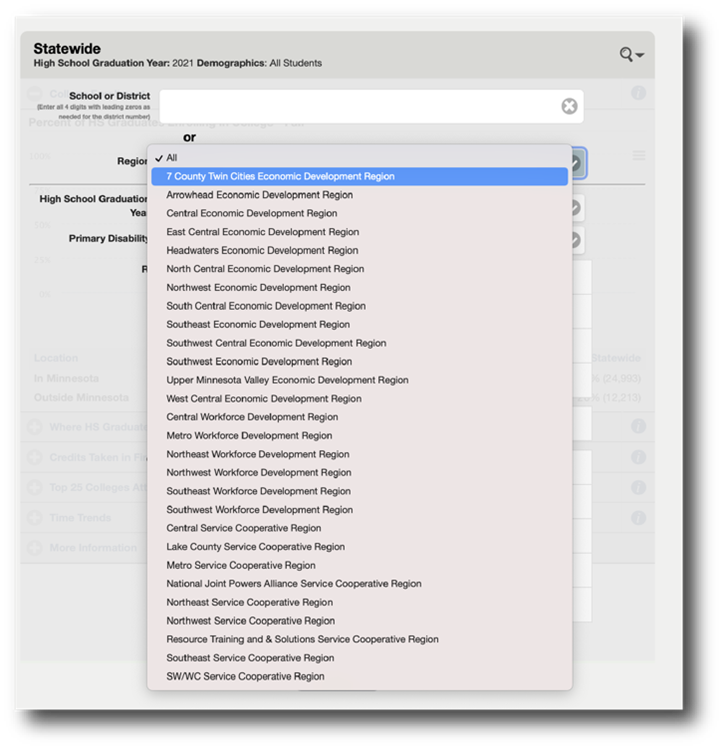
SLEDS reports can help you learn about students, their educational pathways, progress, and outcomes. Filters can help you disaggregate data to gather information that is most useful to you. In our efforts to provide more flexibility and quick access to customized data, SLEDS now features more geography filters in most public reports: Minnesota's thirteen Economic Development Regions (EDRs).
Access the new filters by selecting the magnifying glass icon on the right corner of a report, select the region drop-down options, and choose the EDR of your preference.
Finally, if you would like assistance with navigating any of the SLEDS reports, don't hesitate to contact our Regional Coaching Network for an online demonstration.
Legislative Update
The Minnesota Legislature session ended with positive news approving the budget for both SLEDS and ECLDS. We are grateful to the Minnesota Legislature for their generous support of Minnesota's longitudinal education data systems.
The Minnesota Office of Higher Education (OHE) has administrative responsibility for both SLEDS and ECLDS, which together are recognized as Minnesota's P-20W (preschool through workforce) data system, under the direction of the P-20 Education Partnership. The latest budget approval ensures that SLEDS and ECLDS will receive continued and expanded state funding for state fiscal years 2024 and 2025 that will allow for strong administrative and technological support, and a more robust ECLDS+SLEDS Regional Coaching Network, a team of experts who can assist you in navigating ECLDS and SLEDS data reports, as well as accessing and analyzing data.
Tips and Tools
Do you know about MCIS? The Minnesota Career Information System (MCIS) is a web-based career planning tool that helps high school students determine their postsecondary path and career. Minnesota requires that all students develop a Personal Learning Plan to set goals, explore career aspirations, identify career pathways, and plan their next steps.
The SLEDS-MCIS project is now open to any school with an MCIS license who wants to see longitudinal data for their graduates. This information can help you assist your students in their career planning efforts and finding purpose and a path to success. Data points include:
Career goals
- Favorite occupations, programs of study, colleges or universities
- Student plan after high school
- Postsecondary enrollment (United States and territories)
- Employment and wages by industry sector
If you would like to learn more about MCIS, please contact Traci Valentino at traci.valentino@state.mn.us. You may also download the flier and share it with your network.
News
SLEDS Data Partnership Granted Access to AISP Community
Release date: May 25, 2023
Earlier this month Generation Next, a Minnesota non-profit organization that currently uses SLEDS data to explore specific patterns of postsecondary enrollment and attainment, was granted a spot in Cohort 2 of the Equity in Practice Learning Community (EiPLC) at the Actionable Intelligence for Social Policy (AISP).
Founded in 2012, Generation Next focuses in eliminating the opportunity and achievement gaps seen by students in the Twin Cities. Their cradle-to-career approach has grown into a highly engaged coalition of partners that aim to have a data-driven impact on students' experience. Among its collective, this coalition includes Northside Achievement Zone (NAZ) and Saint Paul Promise Neighborhood (SPPN), two of the key data integration partners taking part in the submitted proposal to AISP. These organizations provide deeper understanding of the data shared by the Minnesota Office of Higher Education (OHE) and the Minnesota Department of Education (MDE) through SLEDS.
Data sharing and integration, especially sourced from different sectors, can provide actionable metrics in response to identified inequities in an effort to improve the living experience and educational outcomes of students. AISP's Equity in Practice Learning Community (EiPLC) is designed to help cross-sector data sharing efforts to build an infrastructure that shares power and knowledge with communities with the intent to achieve more equitable communities. This initiative is supported by the Walton Family Foundation and the Ford Foundation, receiving two new grants that are funding this year's EiPLC. As a cross-sector site team, Generation Next will receive training from AISP, support from equity fellows and peers, and direct grants to fund community participation.
The AISP community is comprised of practitioners, policy-makers, researchers, and community partners who connect with other members to share innovations, best practices, research, and funding opportunities. Taking part in the AISP's EiPLC will provide valuable insight to Generation Next, helping them learn from peers about their data-integration efforts, and receive feedback on their efforts.
As for SLEDS, this project brings to state agencies the opportunity to learn from this AISP community and to strengthen data sharing partnerships that will ultimately advance student success.
News
Data Insights on the Road
Release date: May 25, 2023
Connect with other local data users while learning about ECLDS, SLEDS, the Minnesota Student Survey, and the MDE Data Center. Daylong sessions will be held at various locations across the state so you can work alongside others who are interested in using and sharing publicly available data for program improvement, asset-framing, and strategic planning.
We're focusing the content on information useful for Education Partnerships Coalition members, ECLDS+SLEDS Regional Coaching Network members, Regional Labor Market Analysts, Full-Service Community School partnership staff, Regional Prevention Coordinators, and more.
The workshop is from 9:00 am to 3:00 pm with a light lunch provided, and currently scheduled for the following dates:
- May 31 (Wed) - Resource Training and Solutions, Sartell
- June 1 (Thurs) - Southeast Service Cooperative, Rochester
- June 5 (Mon) - Southwest West Central Service Cooperative, Marshall
- June 14 (Wed) - Northwest Service Cooperative, Thief River Falls
- June 15 (Thurs) - Northeast Service Cooperative, Mountain Iron
Registration is free and required. Please reach out to sleds.support@state.mn.us with any questions.
News

Suggested Reading and Data Exploration
Release date: May 25, 2023
We recently published ECLDS+SLEDS 2021-2022 Bi-Annual Report on our website. Beyond describing the scope and purpose of both data systems, the 2021-2022 Bi-Annual Report recalls the achievements seen in the last two years and lays out the strategies our leadership will focus on in the near future. This document offers an opportunity for reflection on the efforts that brought ECLDS and SLEDS to their current status, and provides direction for the work in the years to come that will build a sustainable data system. Complement your reading with ECLDS+SLEDS 2021-2022 Data Highlights publication, an overview of public data reports available to SLEDS and ECLDS users. Each data report features brief descriptions and data interpretations to offer a glance of the educational landscape in Minnesota.
If you are ready for a more hands-on data experience, jump to DEED's website to explore the Graduate Employment Outcome (GEO) tool now including 2020 graduates data. This tool shows how many Minnesota graduates are finding Minnesota jobs and at what wages. Data are available by educational program, award type, institution type and by college.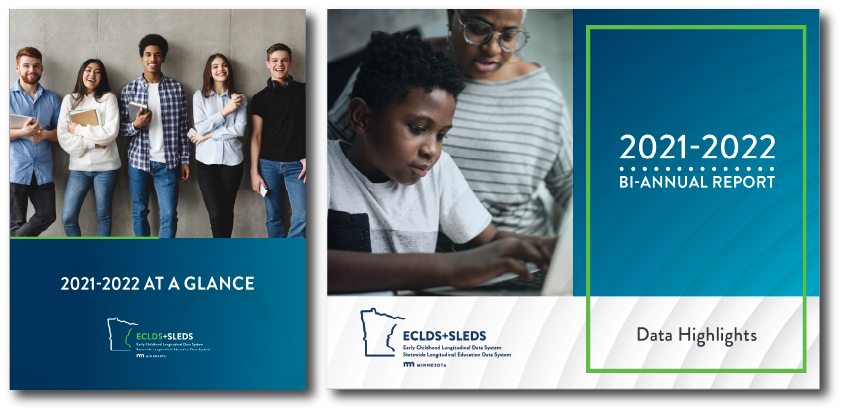
News
SLDS Spotlight: Supporting Data Use Through an Online Learning Hub
Release date: March 30, 2023
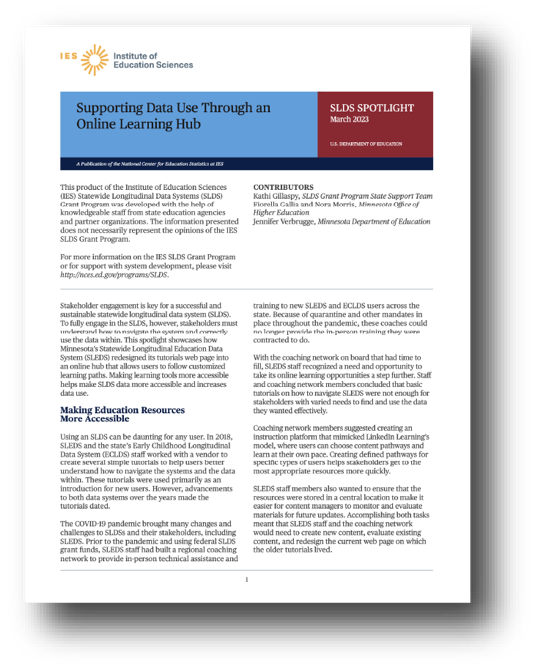 The Minnesota Statewide Longitudinal Education Data System (SLEDS) was recently
featured in a case study by the Institute of Education Sciences (IES). Their
latest publication, SLDS Spotlight, Supporting Data Use Through an Online
Learning Hub, explains how SLEDS reimagined user engagement
leading to the creation of SLEDS Learning. The article details the intention,
conception, and development behind
the project that places stakeholder engagement as the main avenue for a
successful
and sustainable statewide longitudinal data system. For readers not acquainted
with
SLEDS Learning, the hub offers users specific learning paths so they may build
up their data skills and proficiency at their own pace. We invite you to explore
SLEDS Learning and share it with your colleagues.
The Minnesota Statewide Longitudinal Education Data System (SLEDS) was recently
featured in a case study by the Institute of Education Sciences (IES). Their
latest publication, SLDS Spotlight, Supporting Data Use Through an Online
Learning Hub, explains how SLEDS reimagined user engagement
leading to the creation of SLEDS Learning. The article details the intention,
conception, and development behind
the project that places stakeholder engagement as the main avenue for a
successful
and sustainable statewide longitudinal data system. For readers not acquainted
with
SLEDS Learning, the hub offers users specific learning paths so they may build
up their data skills and proficiency at their own pace. We invite you to explore
SLEDS Learning and share it with your colleagues.
News

Check Out the New Data Upload on Selected Reports
Release date: January 19, 2023
We recently completed the review of the latest data upload to SLEDS and ECLDS. Take a few minutes to check your favorite public reports among the following ones showing new data:
- High School Graduates Reports:
- Enrollment
- Completing College
- Developmental Education
- Out-of-State Enrollment
- Course Taking
- Entering the Workforce
- College Students Reports:
- New Student Demographics
- New Students Enrollment
- College Graduates
- Employment
- Adult Basic Education
For a deeper data exploration, visit our website to access and view college enrollment data for 2021 high school graduates in Minnesota and analyze how they compare to students in your district, county, or region. Our reports can help you learn about students, assess educational shortcomings, and inform possible strategies to support positive outcomes in all students. Take the following questions as an initial quest to your data venture:
- How many 2021 high school graduates in your school district enrolled in college the fall after graduation and where did they enroll in Minnesota and out of the state?
- What percent of 2021 high school graduates were required to take developmental courses upon entering college and at which type of institution?
- What percent of 2021 Minnesota high school graduates entered the workforce the fall after graduation and in which industries were they found working?
- How does your graduate class of 2021 compare to prior years? How does it compare to similar school districts and statewide data?
Next, jump onto the College Students reports to look at the updated new college students demographics and enrollment data for entering year 2021-2022. Additionally get the latest data available for the college graduates (awards by race/ethnicity, gender, age, and top ten majors), and employment reports.
If you have access to SLEDS Secure Reports, make sure to check the newly released data on the Postsecondary Research Data Mart for enrollments and completions and the Adult Basic Education report.
Finally, if you would like assistance with navigating any of the SLEDS reports, don't hesitate to contact our Regional Coaching Network for an online demonstration.
News

Watch the Latest SLEDS Presentation at the NCES STATS-DC Conference
Release date: December 6, 2022
This past summer, Meredith Fergus, Director of Research at the Minnesota Office of Higher Education and former SLEDS Coordinator, represented Minnesota as a speaker at the U.S. Department of Education's 2022 National Center for Education Statistics' (NCES) STATS-DC Data Conference.
Her participation in the session titled "Start with Your Questions. What are the Use Cases That Could Drive Future Data Systems?" focused on how Minnesota's data systems have evolved to better support and be responsive to the most pressing needs of our local communities. As a case study, she presented Minnesota's new Direct Admissions program, which uses summary academic profiles created from K-12 Common Course Catalog data found in SLEDS.
The recording of the session is now available to watch online. This session also features speakers from other states that are rethinking the uses and application of their robust data systems to respond to current complex problems in their communities, especially as they recover from the pandemic years.
News
Explore SLEDS New Report on College Transfers
Release date: December 6, 2022
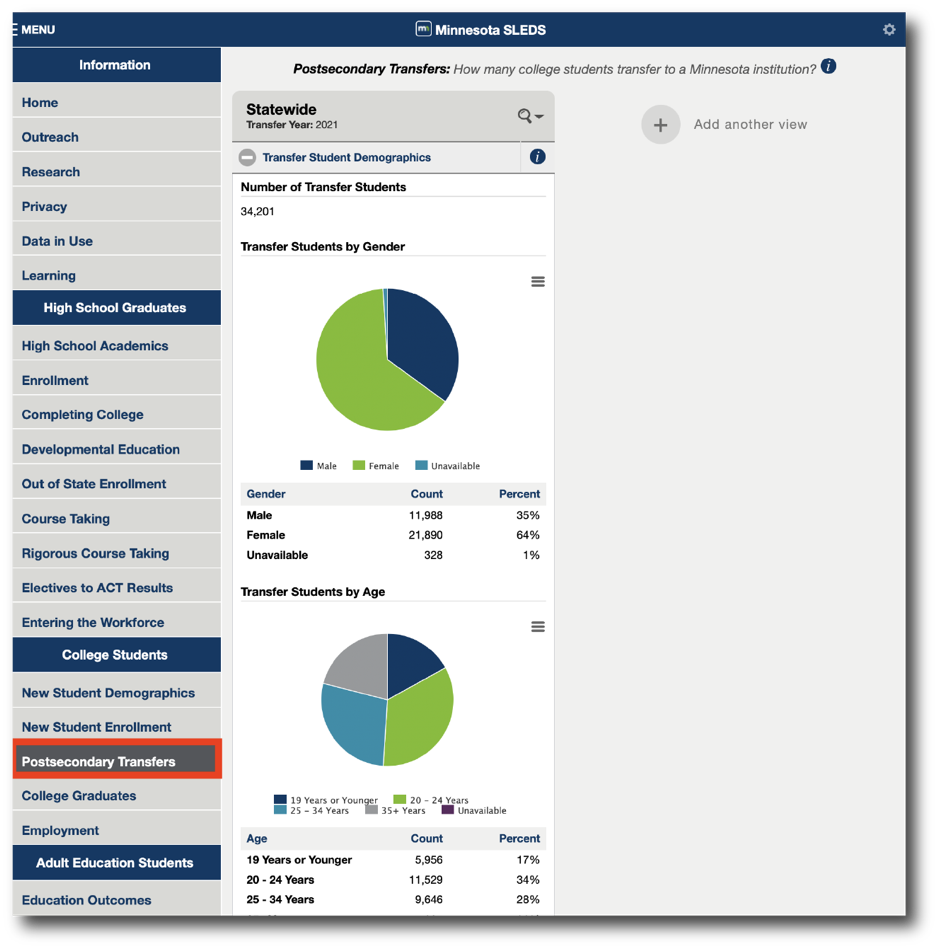
We recently launched the Postsecondary Transfers Report, a new College Students report that provides information about students who transfer to a Minnesota institution, either from another Minnesota institution or from an out of state institution.
The Postsecondary Transfers report shows demographic characteristics of college students who transfer to a Minnesota institution, as well as their activity prior to and after transferring, such as number of institutions attended, highest credential, transfer credits, and completion. For a customized data exploration, we recommend applying the available filters to dig into comparative results. For this new report, users can filter by previous college or system, transfer year, race/ethnicity, gender, age group, transfer term, and Minnesota resident status.
How do students compare?
You can look for:
- The gender, age, and race/ethnicity of transfer students at Minnesota institutions in the selected year.
- Filter options to compare among demographic groups.
- Student activity prior to their transfer: number of institutions attended, time at previous institution, enrollment in developmental education, credential completion, and credits accumulated/transferred. Note that developmental education data is only available for students who previously attended Minnesota institutions.
- Student activity after transfer: completion of their credential and the total number of institutions attended.
News

New Resources for SLEDS Users and Data Newbies
Release date: September 26, 2022
A New Hub for Expanding Your Data Skills
We are happy to introduce a new hub to help SLEDS users and newcomers expand their knowledge of how to use SLEDS data. On the new Learning page, users can access a list of resources to help them explore the website by themselves and learn about the reports published on it.
Resources are organized by subject, making it easy for users to select a learning path and browse the training materials and resources available to them. Among those, we include a series of video tutorials specially created for SLEDS beginner and intermediate users. If you are new to SLEDS, or are recommending the website to someone else, our video tutorials are the perfect resource for learning how to navigate the website, find relevant information, and access all the reports available.
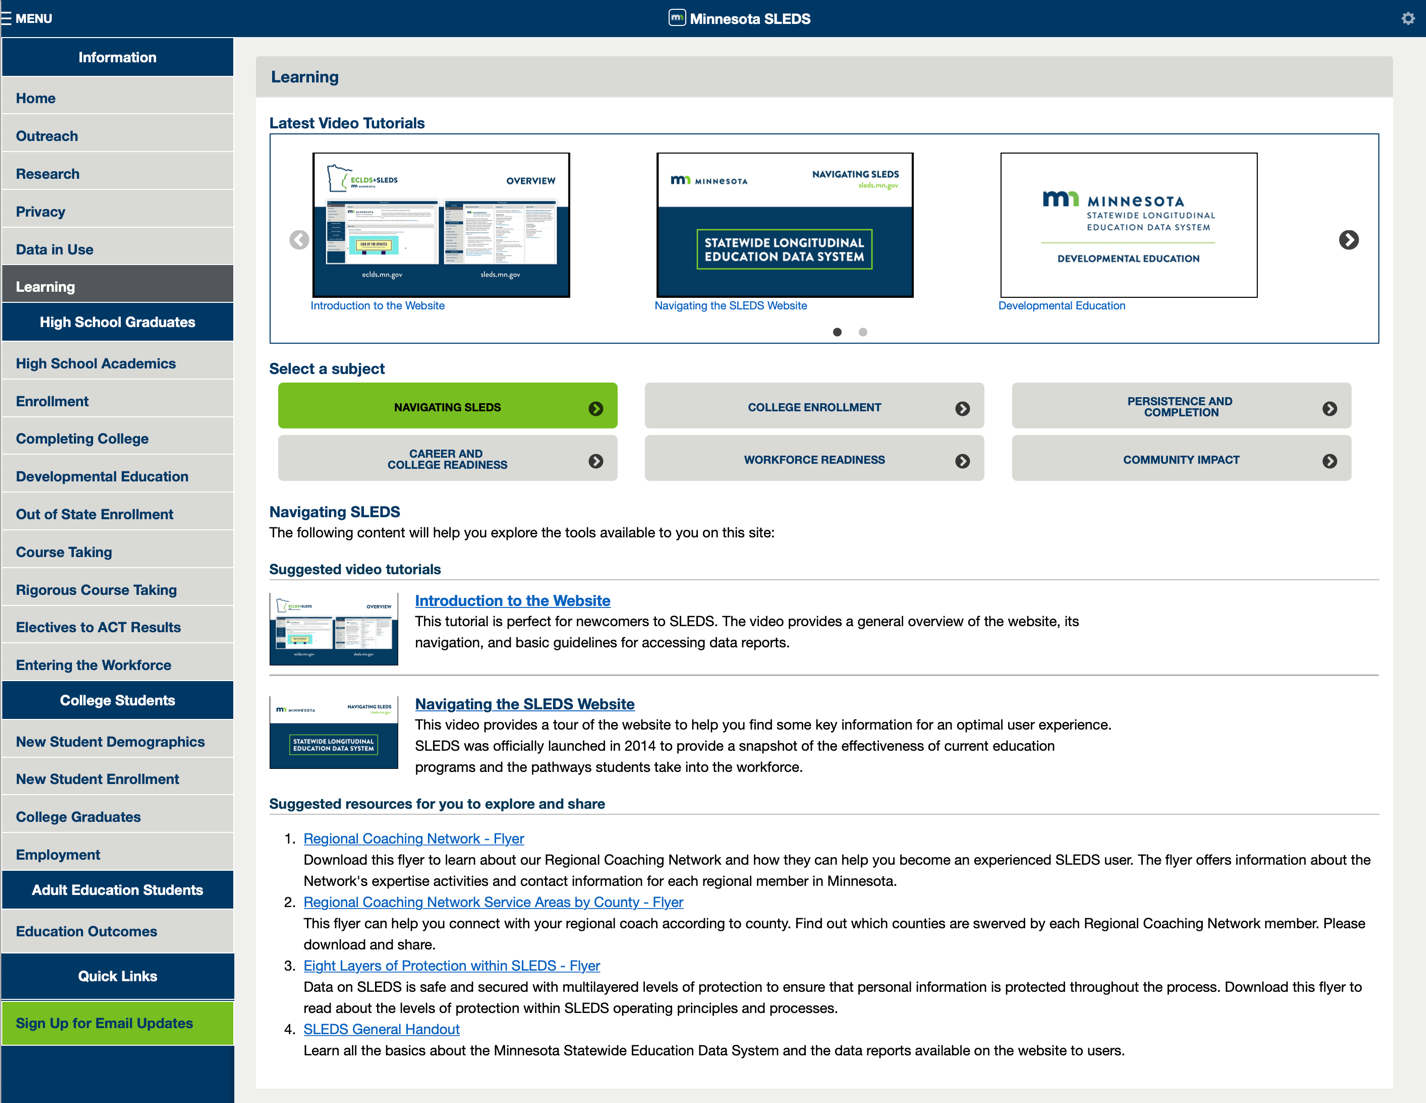
SLEDS Learning has been designed to guide users through specific learning paths at the user's own pace so they may build up their data skills and proficiency. We hope SLEDS Learning will allow new visitors to quickly get acquainted with our website, explore data at length on SLEDS, and use data to inform their decision-making.
Free Posters to Download and Share
We have published a new set of posters that highlight special features on SLEDS to help introduce the system to new data explorers. Feel free to download the resources below and share with your community to spark a conversation about your SLEDS data.
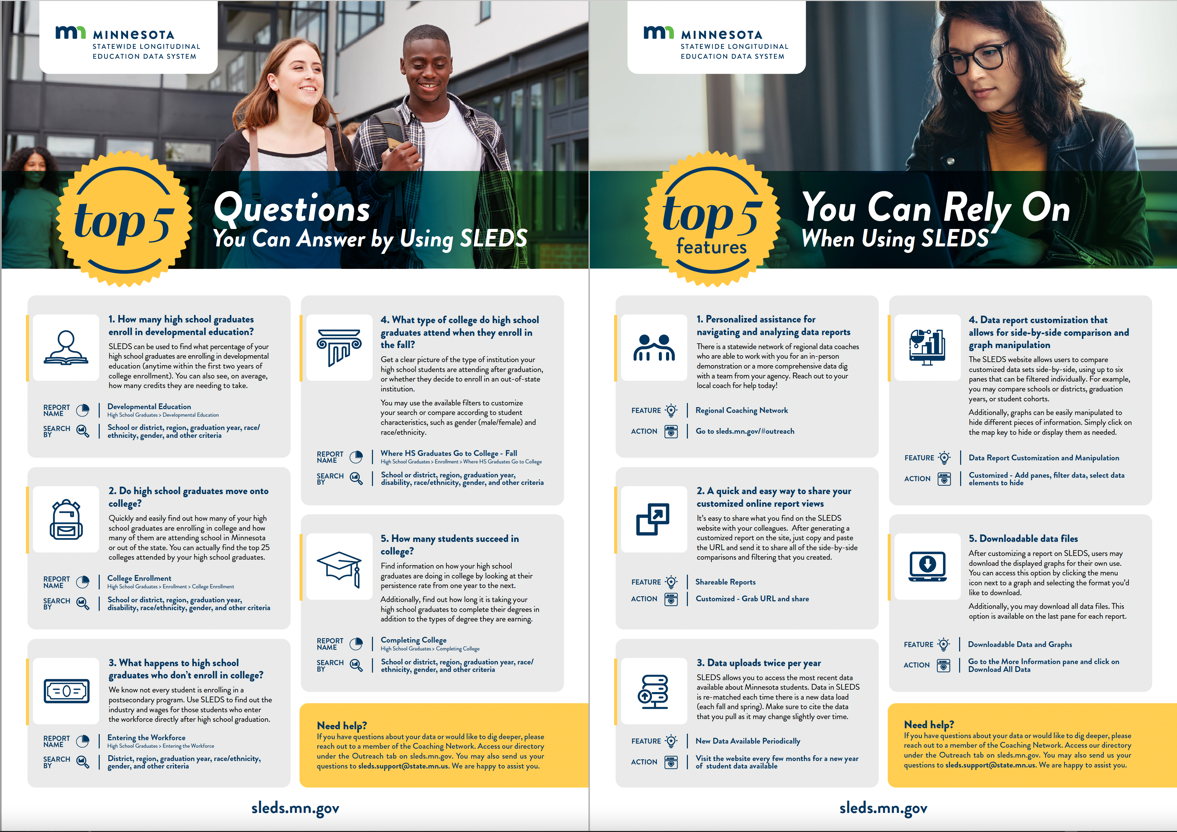
Download Now!
- Top 5 Features You Can Rely On When Using SLEDS
- Top 5 Questions About Your Students You Can Answer by Using SLEDS
If you would like a printed version of this handout, please contact SLEDS Support. We are excited to share!
News
Meet Our New SLEDS Team Members
Release date: September 26, 2022
Nora Morris, SLEDS Director
Nora has spent her career working with teams to use data to improve people's lives. She began her career in health services research, where she provided practice profiles to hospitals, and physicians and coached them in using evidence to improve their care of patients. Nora entered higher education by working in the research department for Minnesota State Colleges and Universities, developing metrics and dashboards that were user-friendly. She most recently served as the Dean of Research and Evaluation at Anoka-Ramsey Community College and Anoka Technical College, where she was responsible for maintaining accreditation, academic program review, enrollment projections, assessment of student learning outcomes, and related projects.
Dr. Morris holds a B.A. in French and economics from St. Cloud State University, and an M.A. in economics from Northern Illinois University, where she also completed a year of doctoral level coursework in economics. In addition, Nora holds an Ed.D. in educational leadership from St. Mary's University of Minnesota. For her dissertation, she used data from SLEDS to study the relationship between college credits earned and post college wages.
Nora lives in St. Anthony Village with her husband Tim and her dog Scout. Her hobbies include spending time with her four grown children and their families, hiking, reading, and cooking.
We are thrilled to have Nora join our team as SLEDS Director.
Maira Rosas-Lee, SLEDS Coordinator
This past July, Maira joined the Minnesota Department of Education (MDE) as the Minnesota Student Survey and SLEDS Coordinator. Her professional experience in youth development, out-of-school activities, health promotion, and school-community collaboration was built working for nonprofit community organizations, universities, and state government.
Maira will be providing intentional training across the state on how to utilize data for program improvement and decision-making. She aims to bridge education and health data to address academic success and health equity in Minnesota using community-based and participatory methodologies.
Maira is a first-generation daughter of Mexican and Korean immigrants. She was raised in Bloomington and currently lives in a cozy suburban home with her toddler, husband, and two dogs. Her latest projects at home are working on her diamond art while listening to audiobooks; it makes her feel double-productive. Her alma mater is the University of Minnesota —both undergrad and grad school!
We are very lucky to have Maira as our new coordinator.
Governance
The Minnesota P-20 Education Partnership governs the SLEDS system. On April 14, 2010, the Minnesota P-20 Education Partnership adopted the following governance structure for the SLEDS system:
- The SLEDS Governance Committee will oversee all work with the data system.
- The SLEDS Research and Data Advisory Committee will review and develop research and evaluation proposals, provide technical expertise on data structure and linkages, and make recommendations to the Governance Committee.
- The SLEDS Coordinators and SLEDS IT staff will coordinate work of the committees and report to the Governance Committee on the research, evaluation and technical operations of SLEDS.
Read the SLEDS Governance Charter
Read the Minnesota P-20 Education Partnership statute (opens new window)
ECLDS+SLEDS FY2024 and FY2025 Biennium Report
The Biennium Report offers an overview of the developments and achievements that ECLDS and SLEDS have seen in the last two fiscal years. It also describes the projects that our staff are working on and the strategies that our leadership will implement in the near future to keep our data systems robust and improve our outreach to more leaders, education administrators, and other stakeholders.
Data Access and Use
For information about interpreting and using the data in SLEDS reports and on the SLEDS website, please see the Data Interpretation Guide.
For information about cell suppression in SLEDS reports and on the SLEDS website, please see the Data Suppression Policy.
The following information is required for access to SLEDS data:
- Data Access Management Policy
- SLEDS Data Access Request Application
- Data Access Request Process and Timeline
- Scoring Template and Rubric
Instructions to access SLEDS Secured Reports
To search variables within SLEDS data, please use the data dictionary.
Data Dictionary (opens new window)SLEDS Research
Minnesota Data
- Getting Prepared
- Graduate Employment Outcomes Tool
- Bachelor's Degree and Career Destination Tool
- College-Going Activity from the National Student Clearinghouse
- Minnesota Department of Education Report Card College-Going
National Resources
- Statewide Longitudinal Data Systems Grant Program
- U.S. Department of Education SLDS Featured Resources
- Workforce Data Quality Initiative
- Data Quality Campaign
Other State SLDS
Data Source Matrix of Available Years of Data
Safeguarding Data in SLEDS
SLEDS links together data from K-12 schools, colleges and work in order to understand the transitions people make between the K-12 education, college and work. This information is used to evaluate Minnesota's many education and training programs to better understand the characteristic of successful transitions between systems and programs. Because this data is about the many Minnesotans who learn and work here, SLEDS is committed to protecting individual privacy and security of information collected.
What is data?
Data are pieces of information collected about the systems and services individuals access and their related outcomes. SLEDS data allows us to measure the performance of publicly supported systems and services that are provided to students and workers in Minnesota. This data is analyzed to measure efficiency of systems and efficacy of services. The limited data included in SLEDS are authorized by federal and state law.
How does SLEDS share data?
Data may only be shared for purposes authorized in federal and state law and requires the requester apply for access using the process approved by the SLEDS Governance Committee.
While personal information is used to link records outside of SLEDS, personal information is removed before the data are placed into SLEDS—de-identifying the data within the SLEDS system. In other words, your data is secured in our SLEDS system.
| Purposes SLEDS shares data | Reasons SLEDS shares data |
|---|---|
| For linking records between state agency data systems | To maintain and operate SLEDS |
| For research to be conducted by state agencies | To evaluate the state's education and training programs, to better understand pathways between education and workforce systems |
| For research to be conducted by schools and colleges | To improve programs and instruction |
| For research to be conducted by approved researchers | To evaluate the state's education and training programs, to better understand pathways between education and workforce systems, to improve programs and instruction at Minnesota schools and colleges on behalf of a state agency, school or college |
How do federal and state laws govern how data is protected and shared?
Education, employment and training data is governed by state law (Minnesota Statutes, Chapter 13). In addition, education data are also governed by federal law, the Family Educational Rights and Privacy Act (FERPA), and its regulations in 34 CFR Part 99.
Minnesota's Data Practices Act
The Data Practices Act (Minnesota Statutes, Chapter 13), makes all government data public unless state or federal law specifically limits access to it. Education and employer data are private under Chapter 13. This law also describes government's duty to respond to data requests made by a member of the public or by the subject of the data.
The Act seeks to balance three principles:
- Government's need to have data to do its work
- The need to maintain an accountable and transparent government
- The need to protect individual privacy rights
The Family Educational Rights and Privacy Act (FERPA)
The federal law on student privacy, the Family Educational Rights and Privacy Act (FERPA), establishes student privacy rights by restricting with whom and under what circumstances states and educational organizations may share students' personally identifiable information.
Additional Resources
Following are some federal and state resources for you to learn more:
Regional Coaching Network
If you are new to SLEDS or would like assistance with navigating our data reports, we encourage you to contact a data coach for an in-person demonstration. Our members work proactively with local schools, districts, colleges, and workforce agency staff.
| Regional Network Members | Location | Contact Person | |
|---|---|---|---|
| BrightWorks (formerly Metro ECSU) | Arden Hills, MN | Anna Paulson* | anna.paulson@brightworksmn.org |
| Center for Applied Research and Educational Improvement (CAREI), University of Minnesota | Saint Paul, MN |
Alyssa Parr Anne Larson* |
akparr@umn.edu Lars4959@umn.edu |
| Century College | White Bear Lake, MN | Erin Osborn | Erin.Osborn@century.edu |
| Lakes Country Service Cooperative | Fergus Falls, MN | Megan Peterson | mpeterson@lcsc.org |
| Northeast Service Cooperative | Mountain Iron, MN | Lisa Kvas | lkvas@nescmn.net |
| Northwest Service Cooperative | Thief River Falls, MN | Jake Seuntjens | jseuntjens@nwservice.org |
| Resource Training and Solutions | Sartell, MN |
Alison Orgaard Jennifer Johnson* |
aorgaard@resourcecoop-mn.gov jjohnson@resourcecoop-mn.gov |
| Sourcewell | Staples, MN | Brenda Sprenger | brenda.sprenger@sourcewell-mn.gov |
| South Central Service Cooperative | North Mankato, MN | Kim Mueller | kmueller@mnscsc.org |
| Southeast Service Cooperative | Rochester, MN | Mike Schnell | mschnell@ssc.coop |
| Southwest West Central Service Cooperative | Marshall, MN | Eric Schwankl | eric.schwankl@swwc.org |
* ECLDS Specialist
Resources
Feel free to use the resources below when you share SLEDS with your community. If you have heard a SLEDS presentation and would like a handout not posted below, please contact SLEDS Support, we are excited to share!
- Postsecondary Transfers Report (handout)
- Regional Coaching Network - flyer
- Regional Coaching Network Service Areas by County - flyer
- Understanding How Career Planning Influences Outcomes - MCIS
- Top 5 Features You Can Rely On When Using SLEDS
- Top 5 Questions About Your Students You Can Answer by Using SLEDS
- SLEDS User Quick Guide: High School Graduates Reports
- SLEDS User Quick Guide: College Students Report
- Earning a Living in Minnesota (infographic)
- Jobs and Wages After College Infographic
- High School to College Transitions - flyer
- Getting Prepared Infographic
- SLEDS General Handout
- Eight Layers of Protection within SLEDS
- Informing Your Needs Assessments and Goal Setting Through SLEDS - Workbook
- SLEDS Completion Placemat
Video Tutorials
The following video tutorials show you how to navigate the website, find relevant information, and access all the reports available to you. You can learn by yourself about the capabilities of specific reports on this site and become more comfortable at exploring and analyzing the data reported.
-
Introduction to the Website: This tutorial is perfect for newcomers to SLEDS. The video provides a general overview of the website, its navigation, and basic guidelines for accessing data reports.
-
Navigating SLEDS Website: This video provides a tour of the website to help you find some key information for an optimal user experience. SLEDS was officially launched in 2014 to provide a snapshot of the effectiveness of current education programs and the pathways students take into the workforce.
-
Enrollment: Our first tutorial for learning how to navigate a report, this video provides detailed instructions for viewing and interpreting data for a selected cohort on college enrollment, college preference, number of credits taken in the first semester, and top 25 colleges attended.
-
Completing College: This tutorial explains how to access and interpret data about college completion and students' persistence through college. Viewers can learn how to compare schools over time and how to compare schools to each other.
-
Developmental Education: The tutorial explores the Developmental Education report and offers contextual information to interpret data in regards to enrollment, type of institutions where students take developmental education courses, ACT scores, college completion, and developmental education enrollment trends.
-
Entering The Workforce: This video tutorial is a step-by-step guide for using the Entering the Workforce report. It offers detailed navigation for viewing data on employment status, wages, and type of industry where high school graduates are found to be working in Minnesota.
Videos
Learn more about SLEDS with these fun videos! We are currently creating more informational videos, check back to this section often.
-
Minnesota SLEDS: This video describes the data used and the potential questions that could be answered using SLEDS data.
-
SLEDS K-12 Data Marts: This video describes the data SLEDS collects from secondary institutions and how teachers and administrators use SLEDS.
-
SLEDS Data Process: This video describes how SLEDS collects data, how data is stored within SLEDS, and the deidentification process. Special guest star, David Reeg, from MN.IT.
Produced by Cutaway Productions.
Learning
Latest Video Tutorials
Select a subject
Navigating SLEDS
The following content will help you explore the tools available to you on this site:
Suggested video tutorials
Introduction to the Website
This tutorial is perfect for newcomers to SLEDS. The video provides a general overview of the website, its navigation, and basic guidelines for accessing data reports.
Navigating the SLEDS Website
This video provides a tour of the website to help you find some key information for an optimal user experience. SLEDS was officially launched in 2014 to provide a snapshot of the effectiveness of current education programs and the pathways students take into the workforce.
Suggested resources for you to explore and share
-
Regional
Coaching Network - Flyer
Download this flyer to learn about our Regional Coaching Network and how they can help you become an experienced SLEDS user. The flyer offers information about the Network's expertise activities and contact information for each regional member in Minnesota. -
Regional Coaching Network Service Areas by County - Flyer
This flyer can help you connect with your regional coach according to county. Find out which counties are swerved by each Regional Coaching Network member. Please download and share. -
Eight
Layers of Protection within SLEDS - Flyer
Data on SLEDS is safe and secured with multilayered levels of protection to ensure that personal information is protected throughout the process. Download this flyer to read about the levels of protection within SLEDS operating principles and processes. -
SLEDS
General Handout
Learn all the basics about the Minnesota Statewide Education Data System and the data reports available on the website to users.
College Enrollment
The following content will help you understand the college enrollment data and how students transition to postsecondary education:
Suggested video tutorials
Enrollment
Our first tutorial for learning how to navigate a report, this video provides detailed instructions for viewing and interpreting data for a selected cohort on college enrollment, college preference, number of credits taken in the first semester, and top 25 colleges attended.
Developmental Education
This tutorial explores the Developmental Education report and offers contextual information to interpret data in regards to enrollment, type of institutions where students take developmental education courses, ACT scores, college completion, and developmental education enrollment trends.
Suggested resources for you to explore and share
-
SLEDS
User Quick Guide: High School Graduates Report
This comprehensive chart can help you understand the data presented contained in the SLEDS High School Graduates report and the filters available for customization. -
High School to College Transitions - flyer
Learn more about the college enrollment trends of Minnesota high school graduates. This flyer is a useful introduction to exploring the High School Graduates Report. -
Getting Prepared Infographic
Learn about college enrollment and developmental educational activity of Minnesota public high school graduates with this infographic. enrolling in college within two years of high school graduation. Developmental education course-taking can be used as a measure of college readiness; the term refers to programs offered by postsecondary institutions to prepare students for success in college-level work. This infographic uses data published in the Getting Prepared Report.
Persistence and Completion
The following content can help you assess the educational success of Minnesota students based on their perseverance and completion of their postsecondary education:
Suggested video tutorials
Completing College
This tutorial explains how to access and interpret data about college completion and students' persistence through college. Viewers can learn how to compare schools over time and how to compare schools to each other.
Suggested resources for you to explore and share
-
SLEDS
User Quick Guide: High School Graduates Report
This comprehensive chart can help you understand the data presented contained in the SLEDS High School Graduates report and the filters available for customization. -
SLEDS
User Quick Guide: College Students Report
This cheat sheet details which data are presented under the College Students reports: new student demographics, new student enrollment, college graduates, and employment. The chart includes the list of filters available for customization. -
SLEDS
Completion Placemat
This placemat is a good way to explore several SLEDS reports while collecting data about your students. -
Getting Prepared Infographic
Learn about college enrollment and developmental educational activity of Minnesota public high school graduates with this infographic. enrolling in college within two years of high school graduation. Developmental education course-taking can be used as a measure of college readiness; the term refers to programs offered by postsecondary institutions to prepare students for success in college-level work. This infographic uses data published in the Getting Prepared Report. -
Postsecondary Transfers Report (handout)
This flier introduces the latest College Students report on SLEDS, Postsecondary Transfers, and the data it provides about newly enrolled college students who have transferred to a Minnesota postsecondary institution, either from another Minnesota institution or from an out-of-state institution.
Career and College Readiness
The following content can help you assess the college readiness of your students or school district:
Suggested video tutorials
Developmental Education
This tutorial explores the Developmental Education report and offers contextual information to interpret data in regards to enrollment, type of institutions where students take developmental education courses, ACT scores, college completion, and developmental education enrollment trends.
Entering The Workforce
This video tutorial is a step-by-step guide for using the Entering the Workforce report. It offers detailed navigation for viewing data on employment status, wages, and type of industry where high school graduates are found to be working in Minnesota.
Suggested resources for you to explore and share
-
Getting Prepared Infographic
Learn about college enrollment and developmental educational activity of Minnesota public high school graduates with this infographic. enrolling in college within two years of high school graduation. Developmental education course-taking can be used as a measure of college readiness; the term refers to programs offered by postsecondary institutions to prepare students for success in college-level work. This infographic uses data published in the Getting Prepared Report. -
Top
25 Majors of Enrollment report
This SLEDS Completion report shows the top 25 majors of high school graduates enrolled in college in the fall. Use it to find out the major preferences of your students or school district. Filter options allow multiple views to compare by school district, region, demographics, graduation year, and other criteria. From a different perspective, this data can be helpful to assess the college readiness and future employability of high school graduates in a community according to the type of award they are choosing to complete. -
The
College and Career Readiness and Success
Center
The American Institutes for Research (AIR) has published their extensive work on college and career readiness that offers educators and policy makers a better understanding of the strategies applied to increase the readiness of students in different communities. -
Career
and College Program Planning
Guide
Published by the Minnesota Department of Education (MDE), this guide provides tools for school districts to determine their needs and set priorities for career and college readiness. The guide includes existing program models around the state, step-by-step action planning, and descriptions of current programs. -
Career
and College Domains and Competencies Guide
MDE published this guide for educators and school administrators to help them plan their K-12 curriculum from a career and college readiness approach. -
Career
and College Data Inquiry Guide
This MDE guide for school administrators provides several indicators that measure career and college readiness (CCR) to improve outcomes for students and close achievement gaps. Using this guide can help you compile data and evaluate the outcomes of students in your school or district from a career and college readiness perspective.
Workforce Readiness
The following content will help you understand the composition of your local workforce:
Suggested video tutorials
Entering The Workforce
This video tutorial is a step-by-step guide for using the Entering the Workforce report. It offers detailed navigation for viewing data on employment status, wages, and type of industry where high school graduates are found to be working in Minnesota.
Completing College
This tutorial explains how to access and interpret data about college completion and students' persistence through college. Viewers can learn how to compare schools over time and how to compare schools to each other.
Suggested resources for you to explore and share
-
Regional Labor Markets
The Minnesota Department of Employment and Economic Development (DEED) publishes comprehensive labor market profiles of Minnesota regions that can be helpful to you for assessing the size and scope of employment in your local area. -
Top
25 Majors of Enrollment report
This SLEDS Completion report shows the top 25 majors of high school graduates enrolled in college in the fall. Use it to find out the major preferences of your students or school district. Filter options allow multiple views to compare by school district, region, demographics, graduation year, and other criteria. From a different perspective, this data can be helpful to assess the college readiness and future employability of high school graduates in a community according to the type of award they are choosing to complete. -
Minnesota
State Career Wheel
This useful chart groups occupational clusters into career fields to help identify career pathways and educational programs. -
Career
and College Program Planning Guide
DEED's interactive tool connects occupational data with educational programming data to map career fields, clusters, and pathways that can help you understand educational path matches employment opportunities. This tool can inform education curriculum, initiatives, and programming to labor market realities, and be a helpful resource to students when choosing a career path. -
Earning
a Living in Minnesota Infographic
This infographic uses findings from the report "Trends, Transitions, and Subgroup Differences on the Pathway to a Family-Sustaining Hourly Wage for Minnesota Students" by the Center for Applied Research and Educational Improvement (CAREI). The study describes the educational pathways Minnesota individuals take from the time they entered high school and explores whether or not these pathways led individuals to earn a family-sustaining hourly wage as an adult to up to 10 years after high school. -
Jobs
and Wages After College Infographic
Download this infographic for a look at the employment outcomes of Minnesota college graduates and their wages a few years into their career.
Community Impact
The following content is meant to provide resources for completing your Community Needs Assessment:
Suggested video tutorials
Using ECLDS for Program Planning
This video tutorial navigates specific data reports and tools on the Minnesota Early Childhood Longitudinal Data System (ECLDS) that can provide useful information for planning local services and programs.
Suggested resources for you to explore and share
-
World's Best Workforce
This resource can help schools develop comprehensive, long-term strategic plans for achieving their educational goals, including increasing student graduation and career and college readiness. -
Informing
Your Needs Assessments and Goal Setting Through SLEDS -
Workbook
SLEDS can be an easy and effective tool for feeding your local data reporting. This workbook explores specific High School Graduates reports that will help you answer local and regional questions related to the World's Best Workforce Report. -
Six
Steps to Completing Your Community Needs Assessment
on Time
This guidebook is a resource for educators and administrators when completing their community needs assessment and identify the strengths and resources available in their community. -
ECLDS
Family Resource Map
This interactive map can quickly help users identify local community resources, such as adult basic education, assistance and low-cost health care providers, education, food resources, housing resources, transportation, or early childhood mental health care programs. -
ECLDS
Census Data
Tool
This tool provides data American Community Survey (ACS) estimates for a more longitudinal look at your county's youngest kids and their families, offering users more focused data for children under age 6. ECLDS is the exclusive online source for these more detailed Census data tables, split into smaller age bands for all states, as well as Washington D.C., and Puerto Rico.
Learning
Introduction to the Website
This tutorial is perfect for newcomers to SLEDS. The video provides a general overview of the website, its navigation, and basic guidelines for accessing data reports.
Learning
Navigating the SLEDS Website
This video provides a tour of the website to help you find some key information for an optimal user experience. SLEDS was officially launched in 2014 to provide a snapshot of the effectiveness of current education programs and the pathways students take into the workforce.
Learning
College Enrollment
Our first tutorial for learning how to navigate a report, this video provides detailed instructions for viewing and interpreting data for a selected cohort on college enrollment, college preference, number of credits taken in the first semester, and top 25 colleges attended.
Learning
Completing College
This tutorial explains how to access and interpret data about college completion and students' persistence through college. Viewers can learn how to compare schools over time and how to compare schools to each other.
Learning
Entering The Workforce
This video tutorial is a step-by-step guide for using the Entering the Workforce report. It offers detailed navigation for viewing data on employment status, wages, and type of industry where high school graduates are found to be working in Minnesota.
Learning
Using ECLDS for Program Planning
This video tutorial navigates specific data reports and tools on the Minnesota Early Childhood Longitudinal Data System (ECLDS) that can provide useful information for planning local services and programs.
Learning
Developmental Education
This tutorial explores the Developmental Education report and offers contextual information to interpret data in regards to enrollment, type of institutions where students take developmental education courses, ACT scores, college completion, and developmental education enrollment trends.